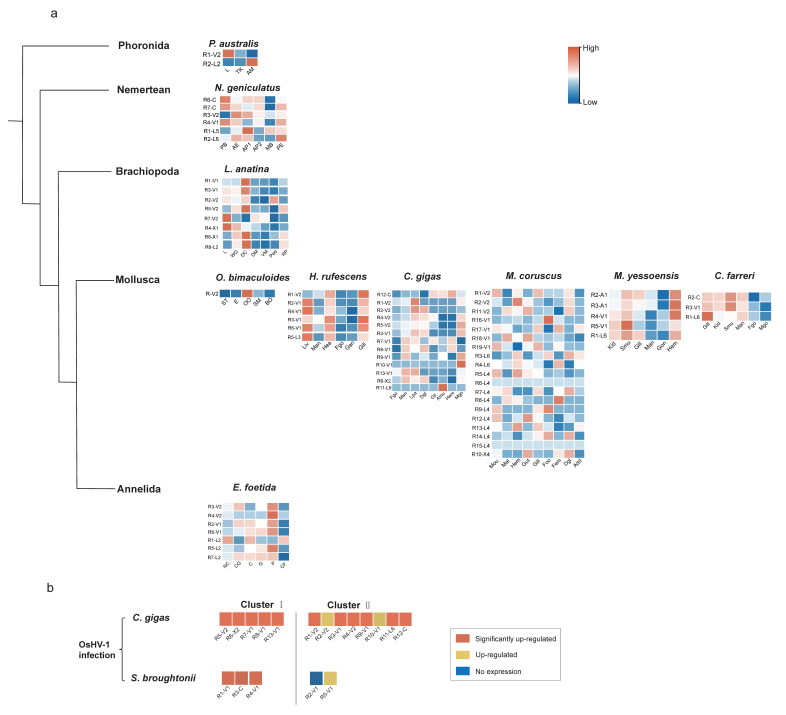
Figure 7.
Expression patterns of RLR genes among different tissues and under virus infection. (a) Transcriptome expression heatmaps of RLRs of different tissues in ten Lophotrochozoa species. Ampulla (AM), trunk (TK), proboscis (PB), anterior end (AE), anterior part1 (AP1), anterior part2 (AP2), mid-body (MB), posterior end (PE), lophophore (L), whole gut tissue (WG), digestive cecum (DC), dorsal mantle (DM), ventral mantle (VM), pedicle (Ped), regenerated pedicle (RP), statocyst tissue (ST), eye (E), olfactory organ (OO), skin from mantle (SM), brain tissue from optic lobe (BO), liver (Liv), mantle (Man), heart (Hea), female gonad (Fgo), adult female ganglion (Gan), gill (Gill), labial palp (Lpa), digestive gland (Dgl), adductor muscle (Amu), hemocyte (Hem), male gonad (Mgo), mouth (Mou), male gonad (Mal), foot (Foo), female gonad (Fem), adductor muscle (Add), kidney (Kid), striated muscle (Smu), gonad (Gon), nerve cord (NC), chlorogog gut (CG), crop (C), gizzard (G), pharynx (P), coelomic fluid (CF). Heatmap displays the expression level of RLR genes. (b) Transcriptional change of the RLRs under Ostreid herpesvirus-1 (OsHV-1) infection. The orange rectangle represents significantly upregulated RLR genes (Log2(FC) > 1.5); the yellow rectangle represents the upregulated RLR genes but not significantly; the blue rectangle represents the RLR genes that are not expressed.

