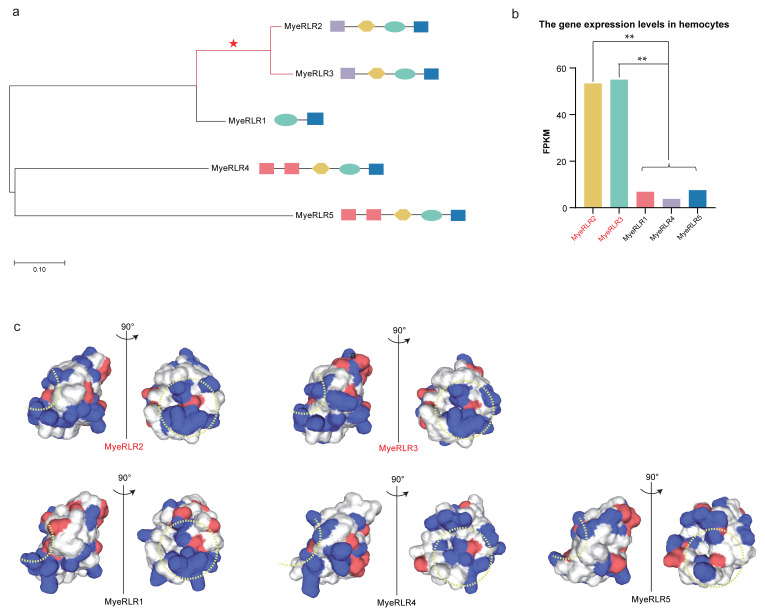
Figure 8.
Positive selection analysis of representative RLR genes. (a) Evolutionary relationships of MyeRLRs. The branches with dN/dS (ω) values > 1.0 are marked with red lines. (b) The expression level of five MyeRLRs in hemocytes. One-way ANOVA showed that the expression levels of MyeRLR2 and MyeRLR3 were significantly (p-value < 0.01, marked with **) more upregulated than those of other MyeRLRs. (c) Electrostatics of the RNA-binding surfaces of the MyeRLR RIG-I_C-RDs. The determination of RNA-binding sites refers to previous studies [49]. Positively charged surfaces are colored blue, and negatively charged surfaces are red. Dotted yellow line indicates RNA-binding loop.

