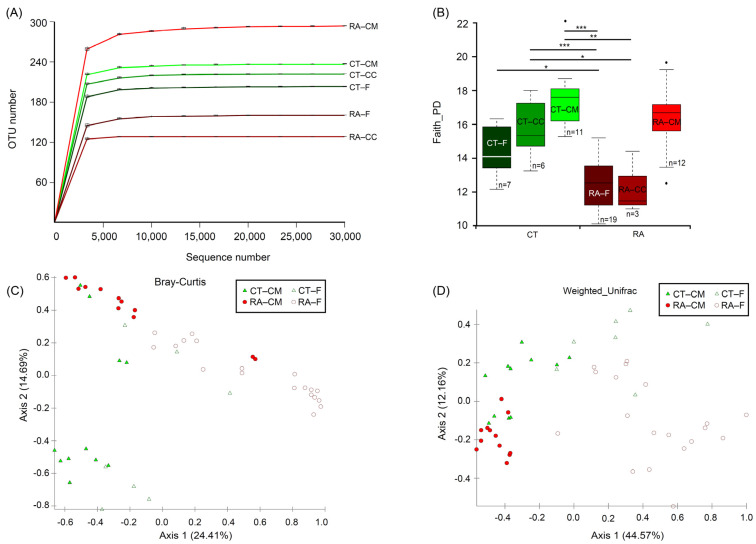
Figure 1.
Alpha- and β-diversity analysis between RA and healthy ICR mice. (A) Rarefaction analysis of 16S rDNA data from RA mice and healthy controls. Each line represents fecal, cecal content and cecal mucus samples. Samples were rarified at an even depth of 31,794 sequences per sample for further analysis. Operational taxonomical units (OTUs) in this analysis were defined at 99% similarity. (B) Faith’s Phylogenetic Diversity comparisons were calculated by Kruskal–Wallis test. Data are median (horizontal line), interquartile range (box edges) and range (whiskers). * p < 0.05, ** p < 0.01, *** p < 0.001. (C) Principal coordinate analysis plot constructed by using the Bray–Curtis distance matrix. (D) Principal coordinate analysis plot constructed by using the weighted-UniFrac distance matrix. CT, healthy controls; RA, rheumatoid arthritis; CM, cecal mucus; CC, cecal content; F, fecal. All mice were from ICR background.

