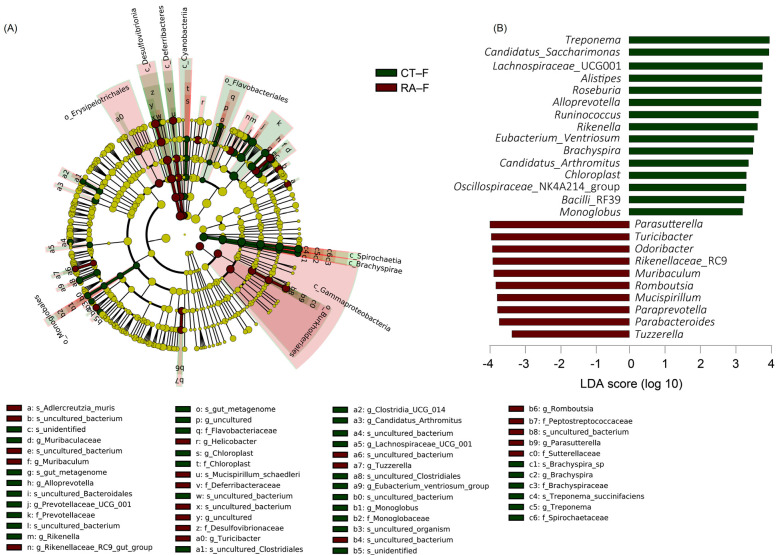
Figure 3.
Linear discriminant analysis effect size (LEfSe) analysis of fecal microbiome in healthy control and RA mouse samples. (A) Cladogram constructed by LEfSe indicating alternations between healthy control and RA samples. Regions in green indicate taxa enriched in healthy controls and regions in red indicate taxa enriched in RA mice. The bottom of the cladogram shows the differing taxa. (B) LDA scores are described in a bar graph.

