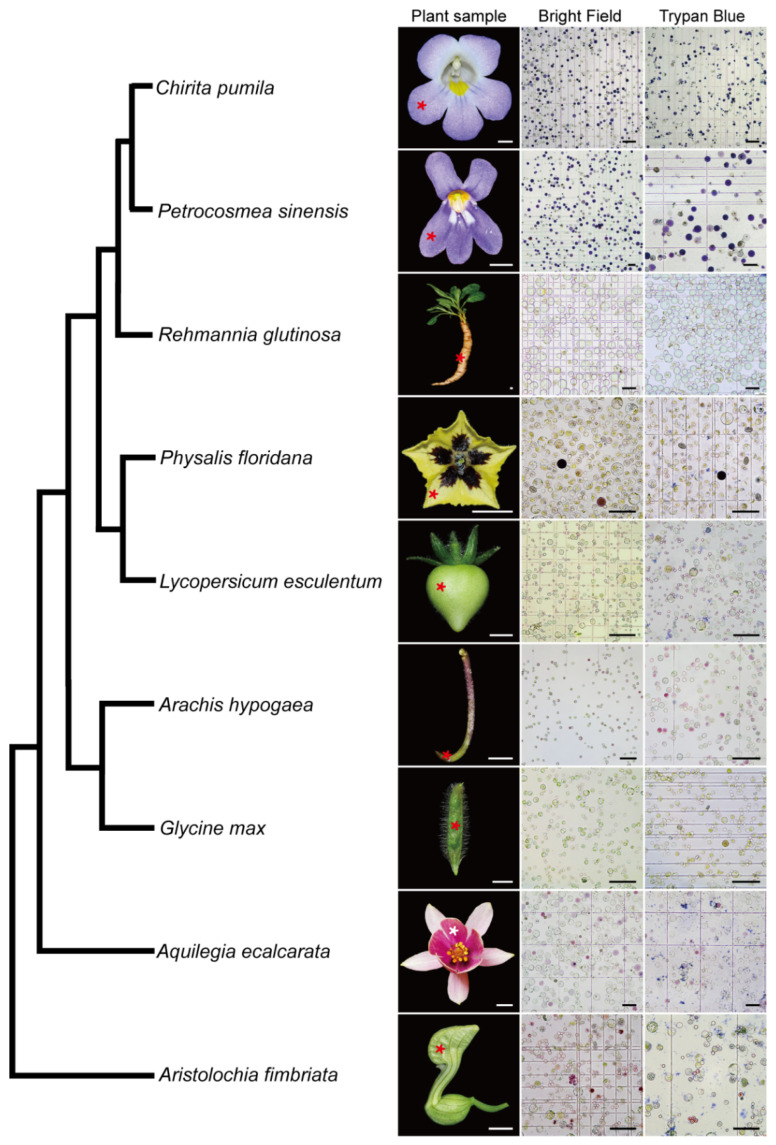
Figure 6.
Validation of the protoplast isolation protocol from representatives of the angiosperm. Please note that some of cells are in dark purple or magenta color due to anthocyanin biosynthesis in the samples. The phylogenetic relationship of the representative species was based on Angiosperm Phylogeny Group (APG) IV. Asterisks in the plant sample row indicate the tissues used for the protoplast extraction. Scale bars, plant samples, 0.5 cm; protoplast images, 100 μm.

