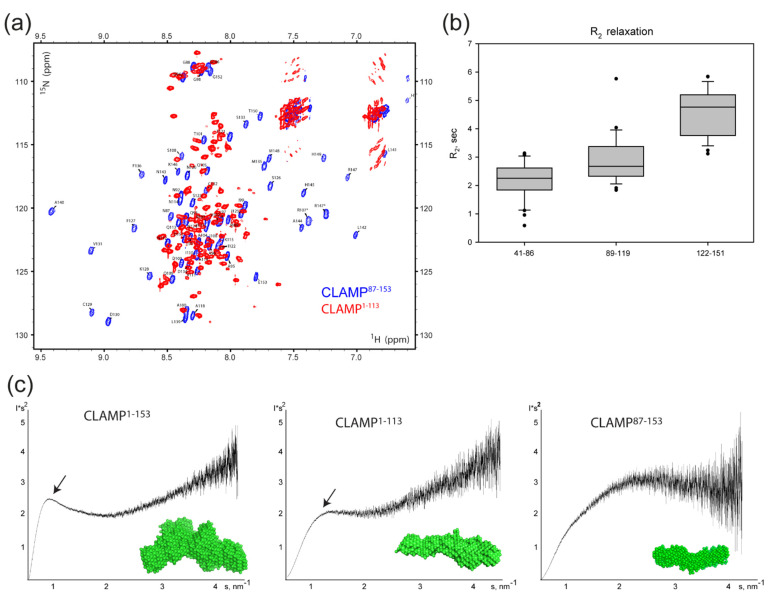
Figure 3.
(a) 15N-1H-HSQC spectra of D. melanogaster CLAMP1–113 (red) and CLAMP87–153 (blue). The amino acid assignment (performed for residues 87–153 in [46], BioMagResBank ID: 34600) is shown. (b) R2 NMR relaxation times for CLAMP residues in 41–86, 89–119, and 122–151 regions. (c) Kratky plots (I*s2 vs. s) of SAXS data derived for CLAMP1–153, CLAMP1–113, and CLAMP87–153 to assess the folding state of protein molecules according to [51]. Bell-shaped areas indicative of folded regions are shown with arrowheads. Averaged ab initio bead models developed from SAXS data are shown as green surfaces (calculated from data obtained at 2.3 mg/mL (CLAMP1–153), 7.0 mg/mL (CLAMP1–113), and 10 mg/mL (CLAMP87–153) by the DAMMIN shape reconstruction program [52] and averaged with the DAMAVER algorithm [53]).

