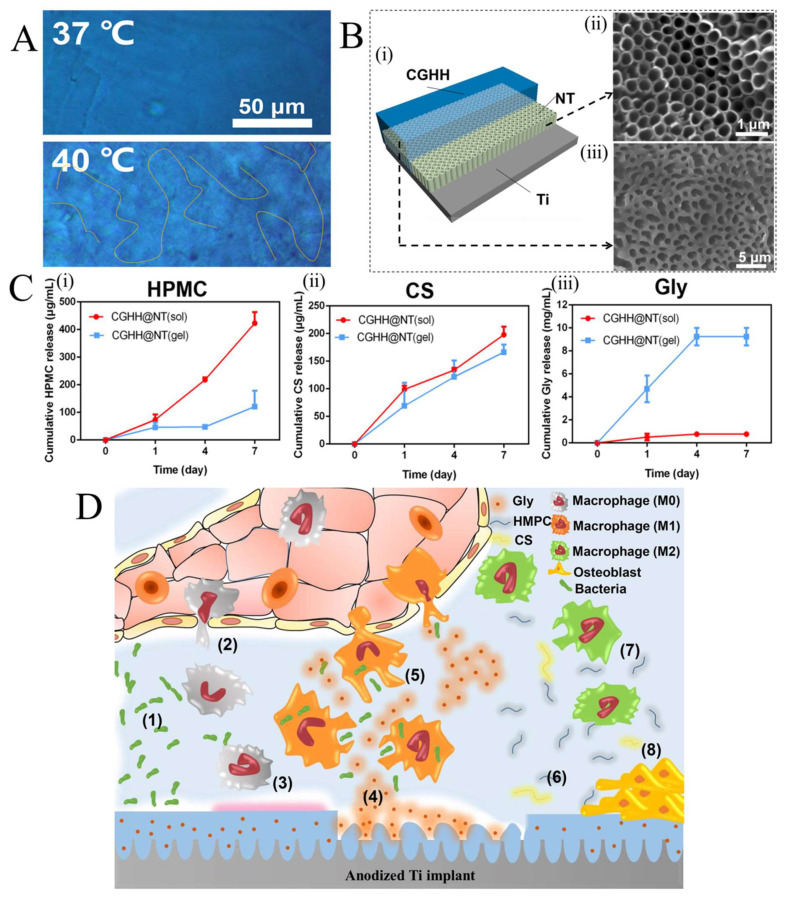
Figure 5.
(A) Optical microscopic images of the hydrogel at 37 °C (sol state) and 40 °C (gel state); (B(i)) schematic illustration of the CGHH@NT sample; (B(ii)) SEM image of the NT sample; (B(iii)) SEM image of the CGHH@NT sample; (C(i)) HPMC release profile; (C(ii)) CS release profile; (C(iii)) Gly release profile; and (D) schematic illustration of the thermo-sensitive immunoregulation of the CGHH@NT sample. Reprinted with permission from [68].

