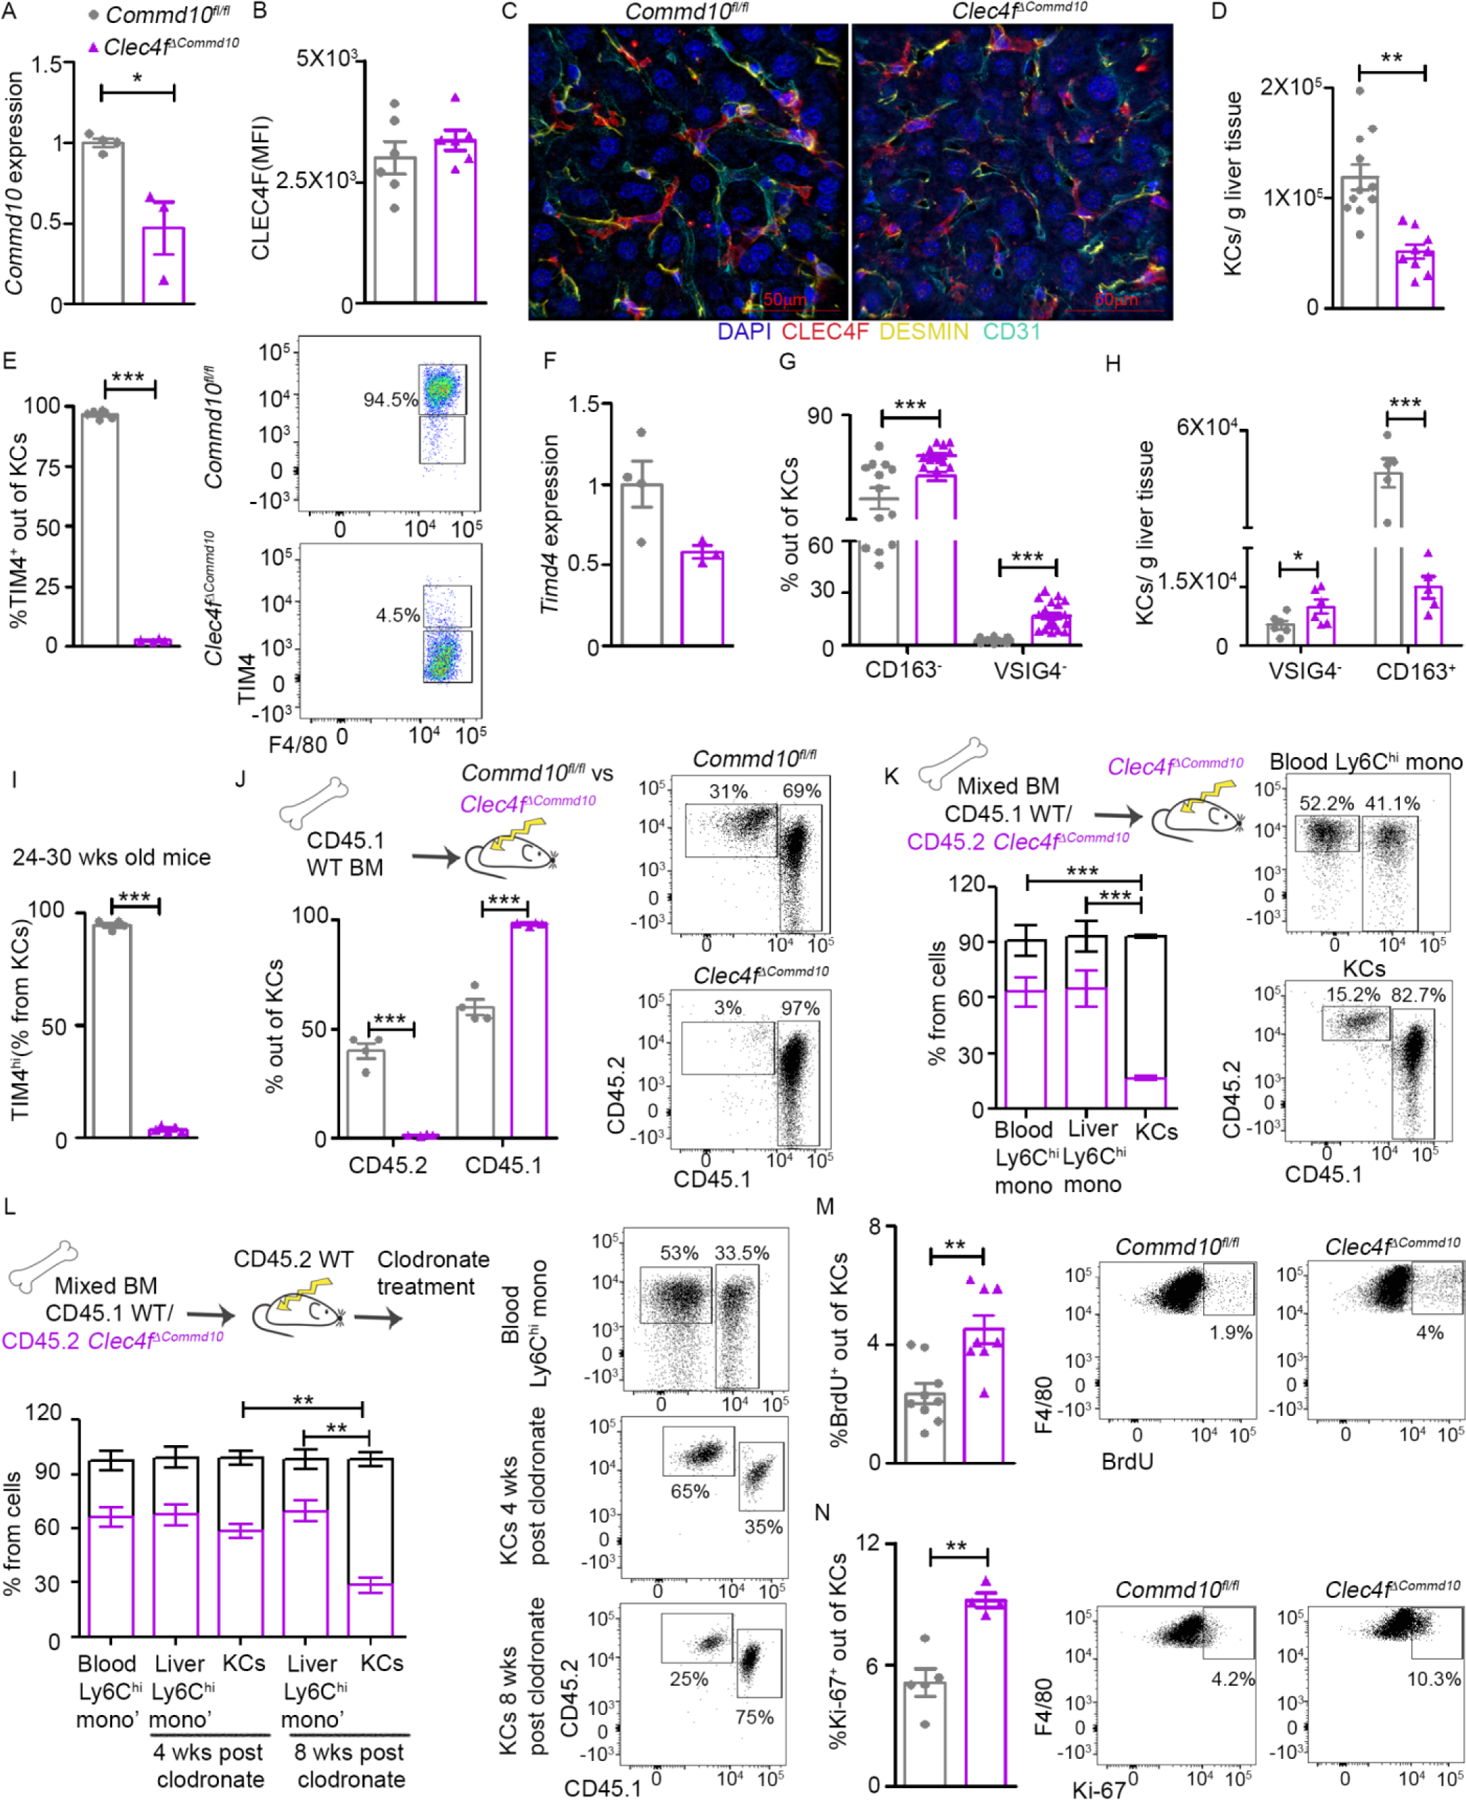
Figure 1. COMMD10-deficient ResKCs are replaced by MoKCs in the healthy liver.

(A-J) KCs from Commd10fl/fl and Clec4fΔCommd10 healthy livers were compared. (A) RT-PCR gene expression of Commd10 (n>3). (B) Mean fluorescence intensity (MFI) of CLEC4F (n>6). (C) Confocal microscopy of livers showing expression of CLEC4F (red), Desmin (yellow), CD31 (cyan) and nuclei (blue), magnification: ×40. Bars=50 μm. (D) KC numbers normalized to liver mass (n>9). (E) Frequency of TIM4+ out of total KCs. (F) RT-PCR gene expression of Timd4 in KCs (n>3). (G) Frequency of CD163- and VSIG4- KCs (n>12). (H) Normalized cell counts of VSIG4- and CD163+ KCs (n>6). (I) Frequency of TIM4hi/total KCs in 24–30 wks old livers (n>4). (J-L) Quantification of % chimerism (J) in KCs at eight weeks post irradiation (n=4). (K) In blood and liver monocytes and KCs at eight weeks post irradiation (n=4). (L) In blood and liver monocytes and KCs as assessed 4/8 weeks post clodronate (n>4). (M) Quantification of BrdU+ cell frequency among KCs (n>7). (N) Quantification of Ki-67+ cell frequency among KCs (n>4). Data were analyzed by unpaired, two-tailed t-test and are presented as mean ± SEM with significance: *p < 0.05, **p < 0.01, ***p < 0.001. Experiments were repeated twice (A, B, H-J, M), once (C, E, F, K, L, N) or at least 3 times (D, G).
