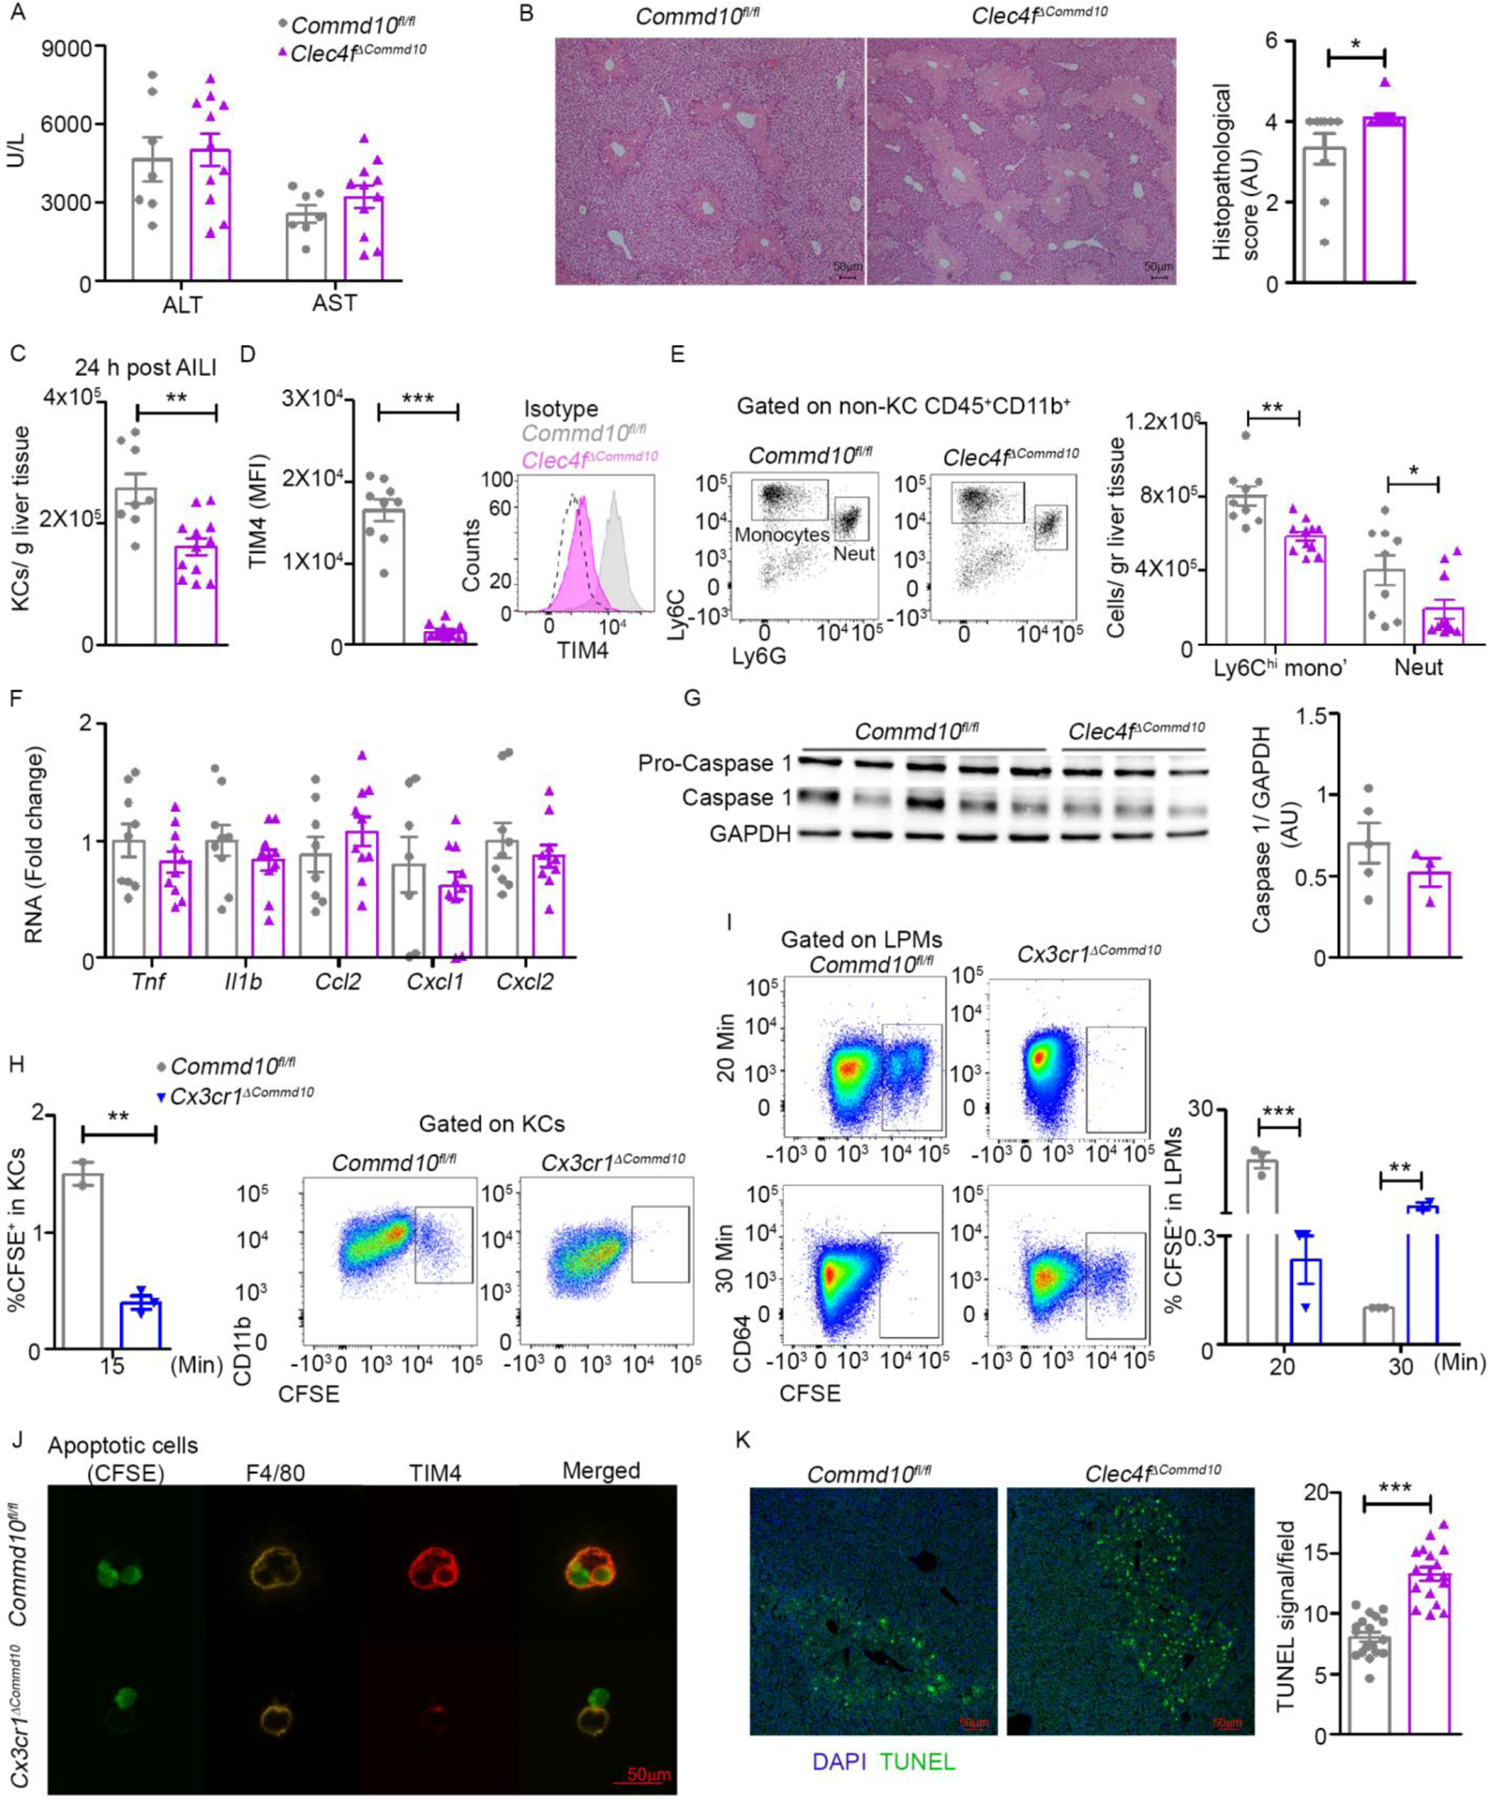
Figure 4: Clec4fΔCommd10 mice display mildly worse hepatic damage in response to acetaminophen-induced liver injury (AILI).

Commd10fl/fl and Clec4fΔCommd10 mice were injected with APAP (300 mg/kg) and sacrificed 24 h later. (A) ALT and AST serum levels (n>5). (B) Histopathological score and representative images of H&E stained liver sections. Magnification= x4. Bars=50µm (n>9). (C) Quantification of normalized KC counts (n>7). (D) Mean fluorescence intensity (MFI) of TIM4 (n>12) in KCs. (E) Quantification of normalized Ly6Chi monocyte and neutrophil counts (n>8). (F) Gene expression of inflammatory cytokines and chemokines quantified by qRT-PCR (n>8). (G) Immunoblot of total liver tissue protein showing caspase-1 activation. GAPDH was used as loading control (n>3). (H-I) Frequency of CFSE-labeled apoptotic thymocytes comparing Commd10fl/fl and Cx3cr1ΔCommd10 mice (H) In KCs 15 minutes post injection of 2×10⁷ apoptotic cells into the portal vein (n>2). (I) In large peritoneal macrophages (LPMs) at 20 and 30 minutes post intraperitoneal injection of 2.5×10⁶ apoptotic cells (n>3). (J) Confocal microscopy images showing expression of F4/80 and TIM4 in isolated LPMs 2 h following exposure to CFSE-labeled apoptotic cells at a ratio of 1:4. Magnification: ×40. Bars=50 μm. (K) Confocal images and quantification of average TUNEL signal per field in Commd10fl/fl and Clec4fΔCommd10 livers at AILI 24 h, magnification: ×10. Bars=50 μm (n=3, 20 images per group). Data were analyzed by unpaired, two-tailed t-test and are presented as mean ± SEM with significance: *p < 0.05, **p < 0.01, ***p < 0.001. Experiments repeated twice (A-F, J) or once (G- I).
