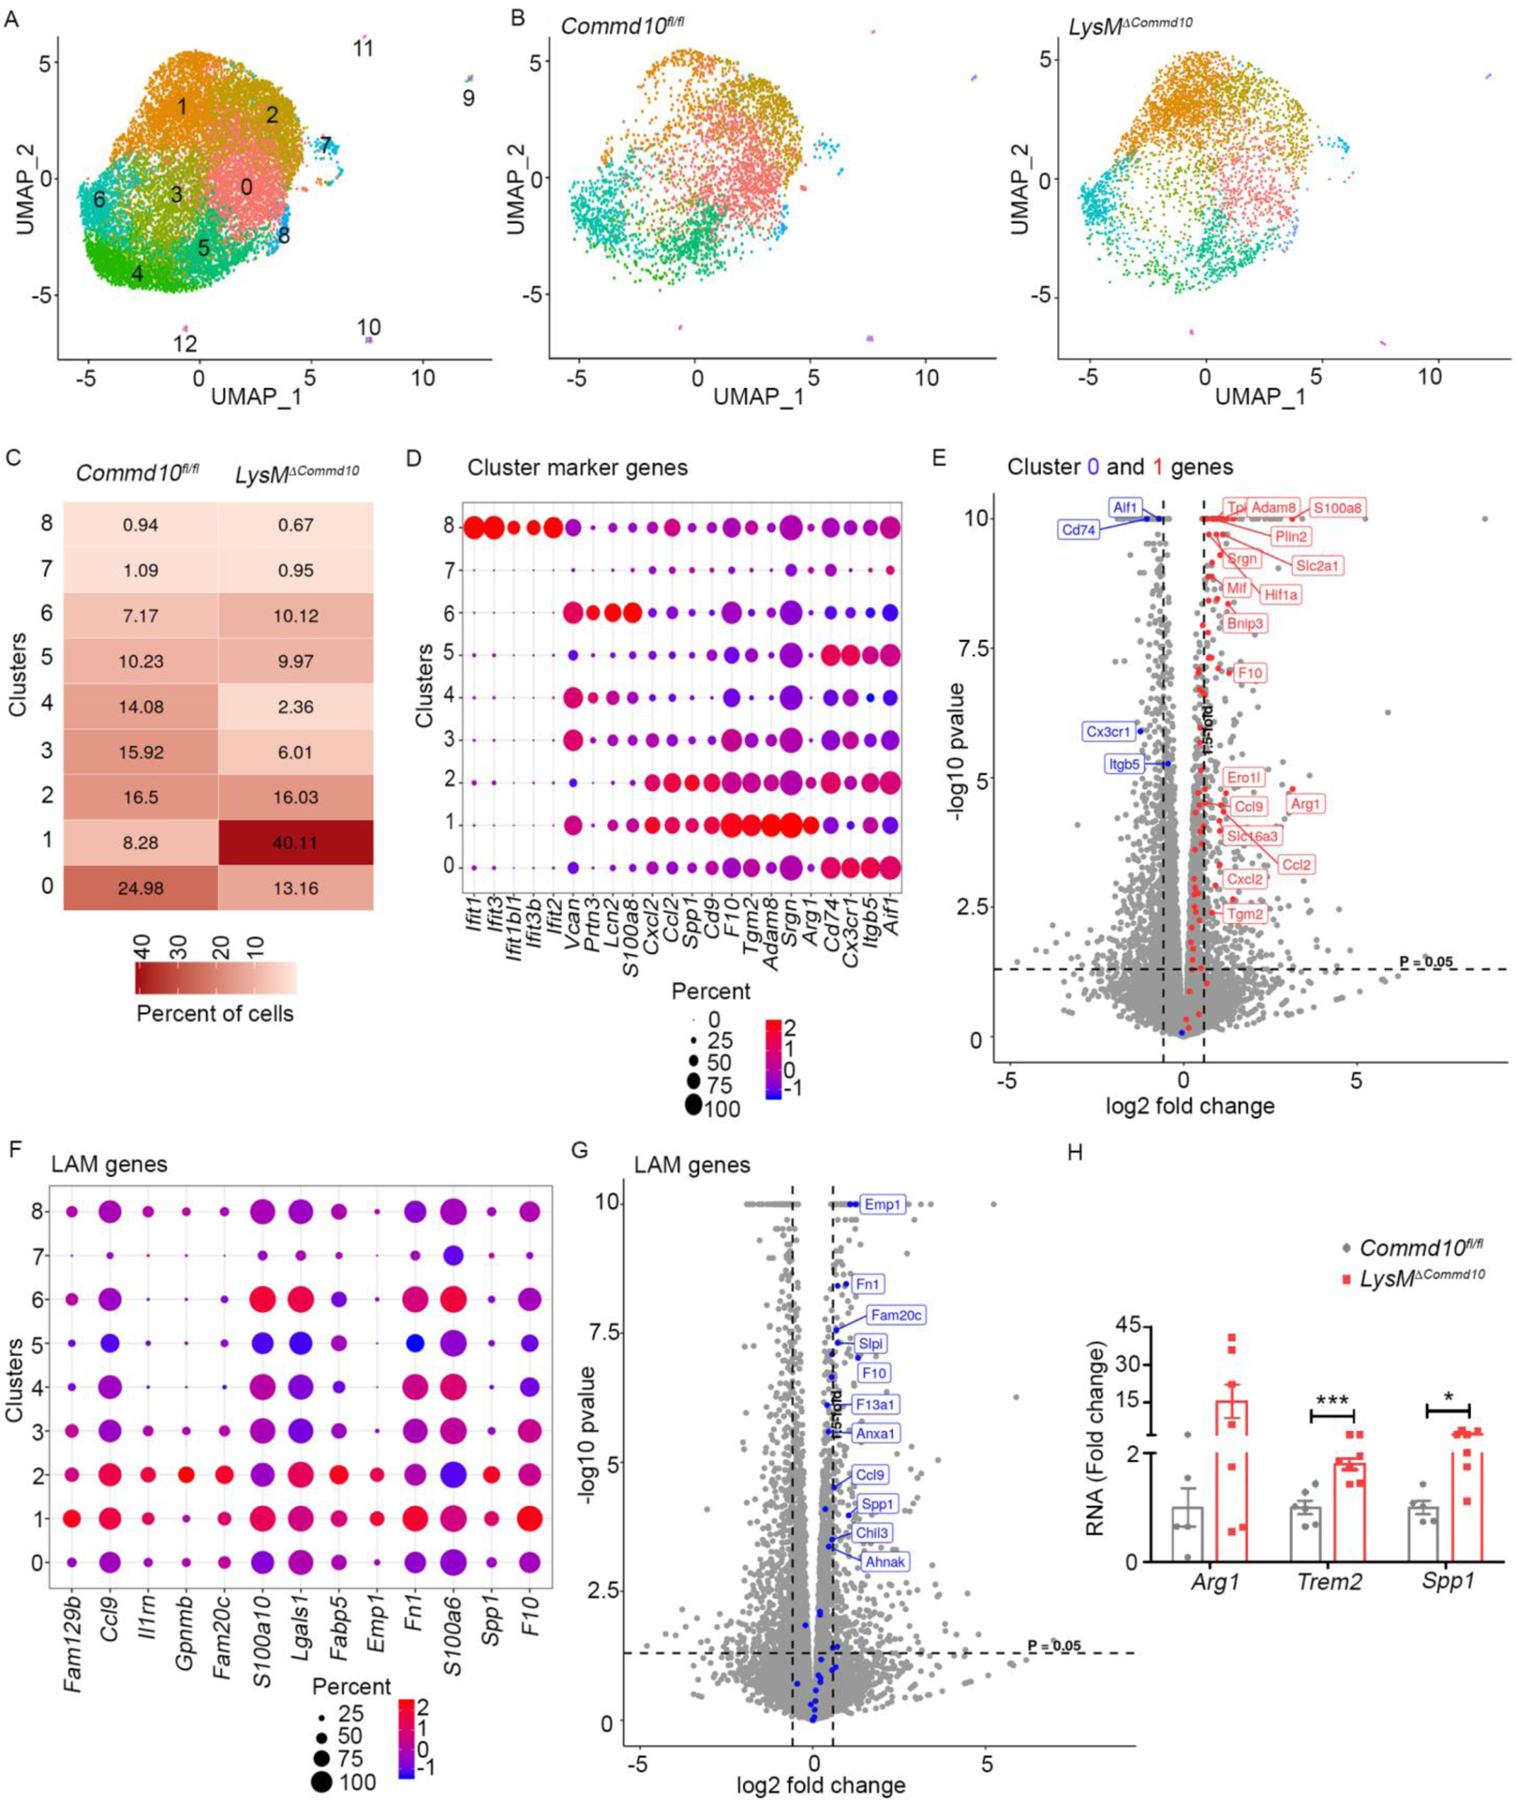
Figure 7: Higher representation of NeuMo and lipid associated macrophages (LAMs) among COMMD10-deficient Ly6Chi monocytes at AILI 24 h.

Ly6Chi monocytes sorted from LysMΔCommd10 and Commd10fl/fl livers (AILI 24 h) were compared by single cell RNAseq analysis. (A) Uniform manifold approximation and projection (UMAP) showing the distribution of Ly6Chi monocytes among 12 distinct clusters. (B) UMAPs displaying distinct patterns of cluster distribution. (C) Table displaying % of Ly6Chi monocytes in each of the main 0–8 clusters (> 100 cells). (D) Expression level and % of specific marker genes across the main clusters. (E) Volcano plot displaying the expression of cluster 0 (blue) and cluster 1 (red) top marker genes in LysMΔCommd10 versus Commd10fl/fl Ly6Chi monocytes (AILI 24 h), as depicted from bulk RNAseq analysis. (F) Expression levels and percentages of LAM genes across the main clusters. (G) Volcano plot displaying the expression of LAM genes among LysMΔCommd10 versus Commd10fl/fl Ly6Chi monocytes (AILI 24 h), as depicted from bulk RNAseq analysis. (H) RT-PCR gene expression analysis of LAM genes, comparing MoMFs sorted from Commd10fl/fl and LysMΔCommd10 livers (AILI 48 h) (n>6). Analysis was performed on differentially expressed genes (≥1.5-fold, p< 0.05) (n>3).
