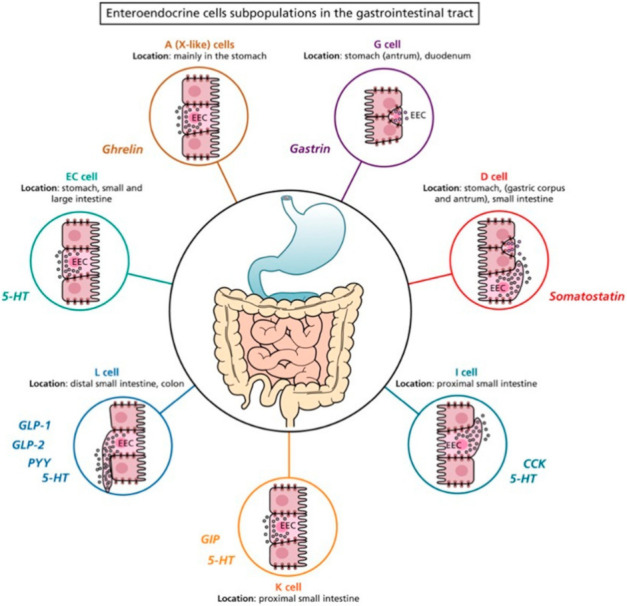
Figure 3.

Schematic representation of the enteroendocrine cell subpopulation in the gastrointestinal (GI) tract. EC: enterochromaffin cell; 5-HT: 5-hydroxytryptamine; CCK: cholecystokinin; GLP-1: glucagon like peptide-1; GLP-2: glucagon like peptide-2; PYY: peptide YY; GIP: gastric inhibitory peptide-1; dark red circle indicates the A cells secreting ghrelin in the stomach (corpus); purple circle indicates the G cells secreting gastrin in the stomach (antrum); red circle indicates the D cells secreting somatostatin in the stomach (pylorum); dark blue circle indicates the I cells and orange circle indicates the K cells secreting CPK and GIP in the small intestine; light blue circle indicates the L cells secreting GLP-1, GLP-2 and PYY, widely distributed in small intestine and in colon. The Figure is obtained from Latorre et al., 2016. Reprinted under the terms of the Creative Commons CC BY license [8].
