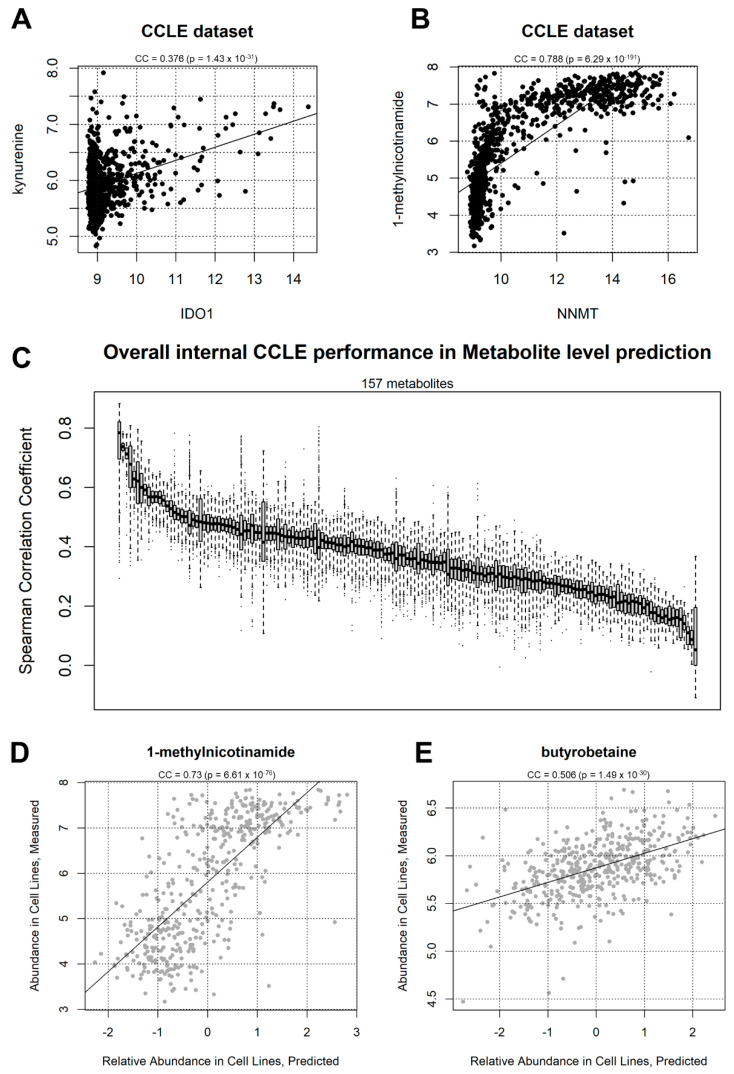
Figure 2.
(A) Correlation between IDO1 gene expression and kynurenine abundance in the CCLE dataset. The Coefficient of Correlation (CC) and the associated p-value are indicated. (B) correlation between NNMT gene expression and 1-methylnicotinamed abundance in the CCLE dataset; (C) overall correlation coefficient distribution between real and predicted metabolite abundance value in 157 metabolites. Each boxplot represents a metabolite, sorted by average correlation, tested across 2000 CCLE partitions (50% of the data used as training and 50% as testing). (D) example correlation between 1-methylnicotinamide measured levels (y-axis) and predicted levels according to corto-aggregated gene expression profiles (x-axis). Each point represents a CCLE sample taken from 445 samples (50%) not used for metabolite-transcript network generation. The example represents an arbitrary split of the dataset into training and testing samples, providing a correlation coefficient similar to the average deducted from 2000 samplings for 1-methylnicotinamide, shown in the previous panel; (E) another correlation example between measured (y-axis) and predicted (x-axis) butyrobetaine levels.

