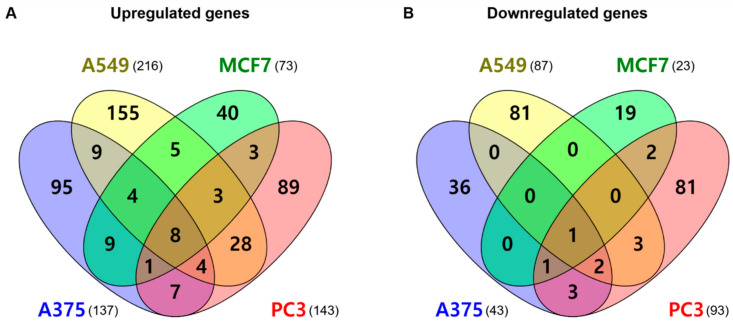
Figure 3.
Venn diagram for the differentially expressed gene (DEG) list in four cell lines. (A) Upregulated genes and (B) downregulated genes. The crossing areas show the commonly changed DEGs. Venny website was used for drawing Venn diagrams (https://bioinfogp.cnb.csic.es/tools/venny/index.html, accessed on 1 October 2021).

