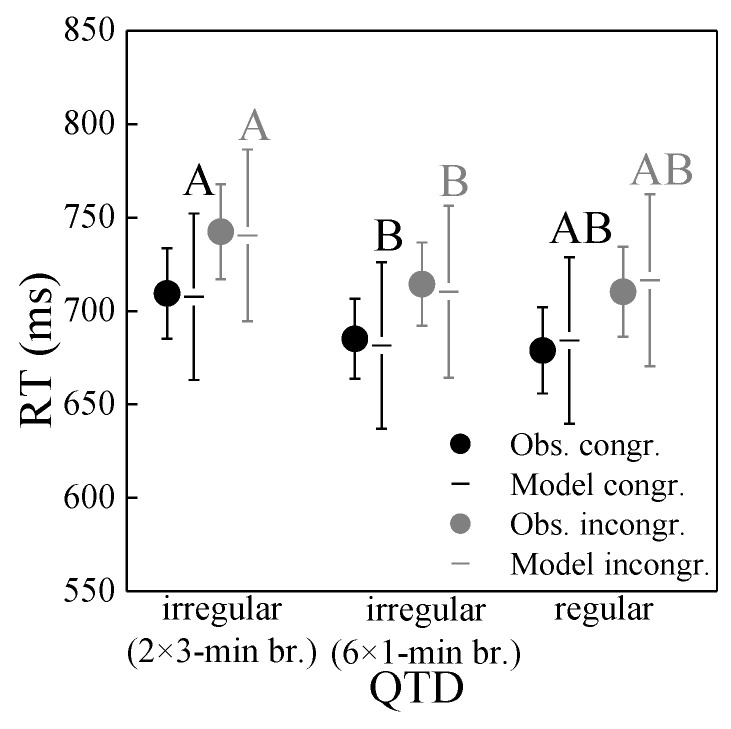
Figure 11.
Reaction time (RT) as a function of quiet time distribution (QTD), for the congruent and incongruent trials of the Stroop task in experiment 2. Circles represent mean observed values (Obs.) with standard error bars, and horizontal lines the corresponding mixed-effects model with 95% confidence intervals. Significant differences between estimated marginal means (p < 0.05; pairwise comparisons with Bonferroni correction, performed separately for the congruent and incongruent Stroop tasks) of different QTDs are indicated by differing letters.

