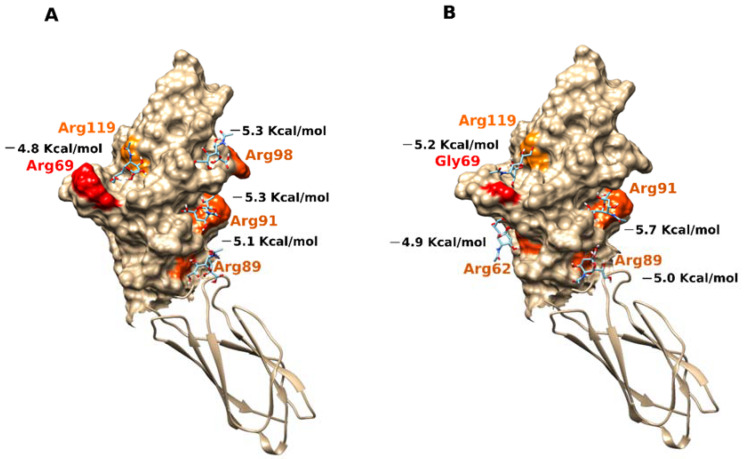
Figure 3.
Sialic acid interactions with the two SNPs of CD33 structures. (A) Surface representation of functional domain of the CD33 predominant form with Arg in position 69, colored in red (PDB ID 5IHB). (B) Surface representation of functional domain of the CD33 variant form with Gly in position 69, colored in red (PDB ID 5IHB). The areas in orange indicate the binding sites of sialic acid, in stick representation, in correspondence with the positively charged arginine residues with which the ligand establishes saline bridges. The values of the binding energy in kcal/mol are reported for each binding site of sialic acid.

