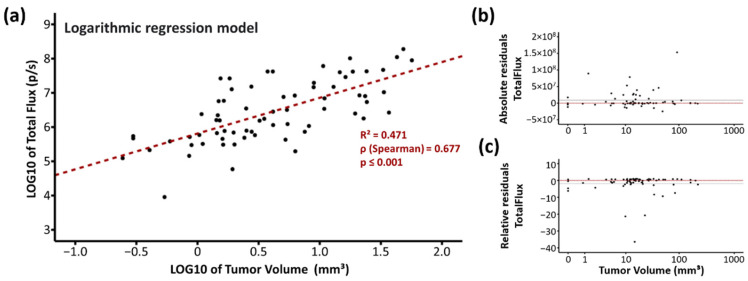
Figure 4.
Correlation analyses of magnetic resonance (MRI) and bioluminescence imaging (BLI) using the logarithmic regression model. (a) LOG/LOG diagram of MRI tumor volume versus BLI total flux. Each point indicates one measurement, n = 74. Coefficient of determination (R2), Spearman’s rank correlation coefficient (ρ) and p value determined by ANOVA are given in the chart. (b) Absolute and (c) relative residuals of total flux. The dotted red line and the solid black line indicate the zero value and the mean value of residuals.

