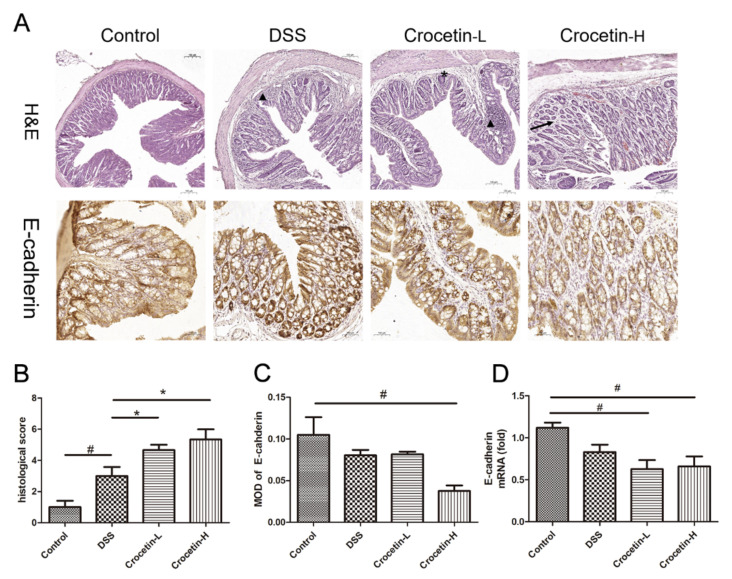
Figure 4.
Evaluation of the effect of crocetin in DSS-induced colitis mice by histological examination and immunohistochemistry. (A) H&E staining and immunohistochemistry of E-cadherin in colon of all groups. Arrow indicates crypt loss, asterisk indicates goblet cell loss, triangle indicates infiltration of inflammatory cells. (B) Histological score in DSS induced colitis. (C) Mean optical density (MOD) of E-cadherin. MOD = sum integrated optical density/area. (D) mRNA expression levels of E-cadherin are shown relative to Control. Data are presented as mean ± SD. * p < 0.05, compared to DSS group; # p < 0.05, compared to Control.

