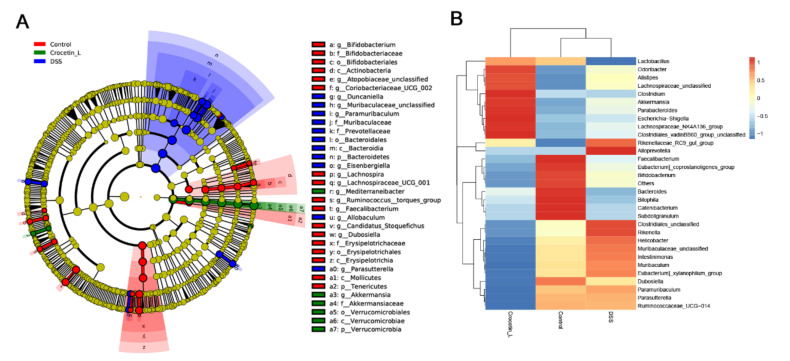
Figure 6.
Differences in composition of the gut microbiota among Control, DSS, and Crocetin-L group. (A) Differential abundance microbiota taxonomic cladogram obtained from LEfSe analysis. (B) Heatmap plot depicting the normalized abundance of each microbiota genus in Control, DSS, and Crocetin-L group.

