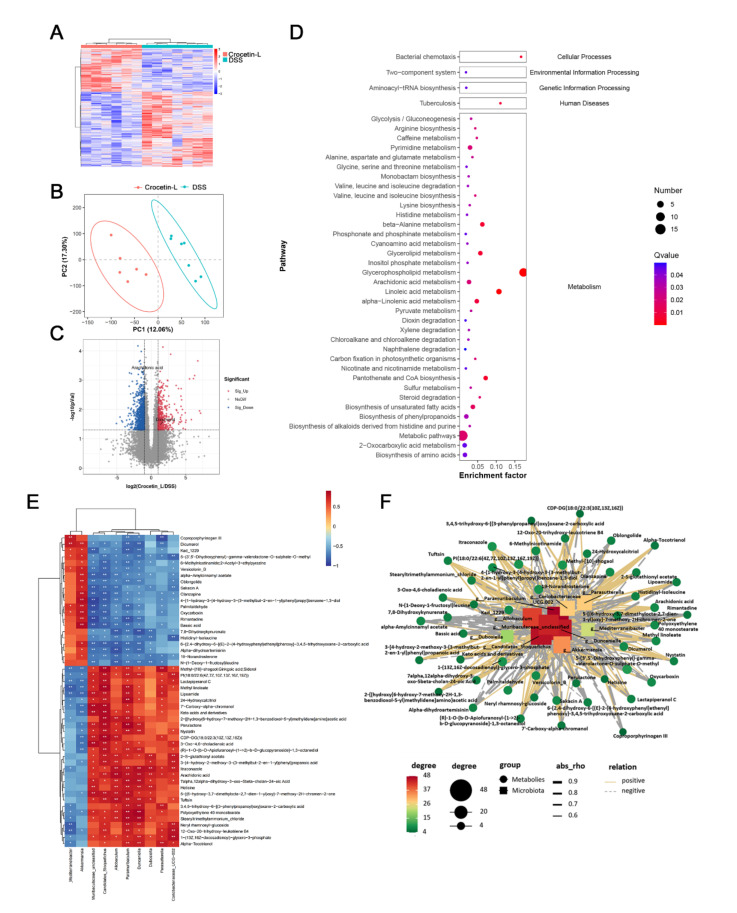
Figure 8.
Gut metabolomic profiling. (A) Heatmap showing the significantly changed metabolites of individuals in Crocetin-L group compared with DSS group. (B) PLS-DA scores plot revealed a clear separation of gut metabolites between the Crocetin-L and DSS groups. (C) Volcano plots of differential metabolites between Crocetin-L and DSS groups, red dots represent significantly up-regulated metabolites, blue dots represent significantly down-regulated metabolites, and grey dots represent metabolites with no significant change. (D) KEGG enriched pathways of differential gut metabolites in Crocetin-L group compared with DSS group. (E) Correlation of gut metabolites and microbiota between the Crocetin-L and DSS group. (F) Correlation network of differential metabolites and microbiota between the Crocetin-L and DSS group.

