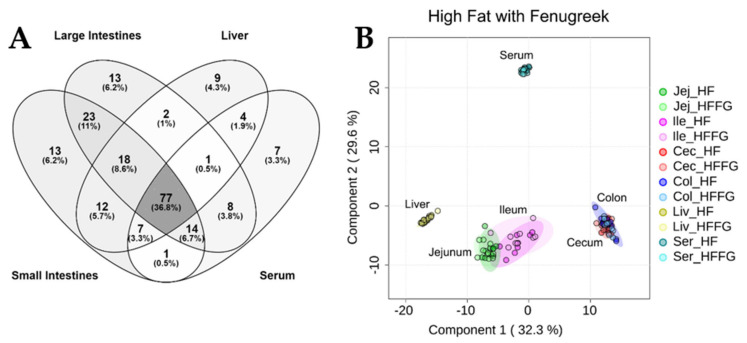
Figure 1.
(A) Venn diagram depicting the overlap of identified metabolites between the small intestines, large intestines, liver, and serum. Of the identified metabolites, 36.8% were detected in all matrices; however, the least overlap was observed between large intestine, liver, and serum samples (0.5%) and between serum and small intestine samples (0.5%). (B) Partial least squares discriminant analysis (PLS-DA) comparing metabolomes associated with HF and HFFG diets for small intestines (jejunum and ileum), large intestines (cecum and colon), liver, and serum. Cross validation values can be found in Supplementary Table S1. Experimental replicates are shown with respective confidence intervals; HF and HFFG jejunum samples are dark and light green; HF and HFFG ileum samples are dark and light pink; HF and HFFG cecum samples are shown in dark and light red; HF and HFFG colon samples are shown in dark and light blue; HF and HFFG liver samples are dark and light yellow, and HF and HFFG serum samples are dark and light teal.

