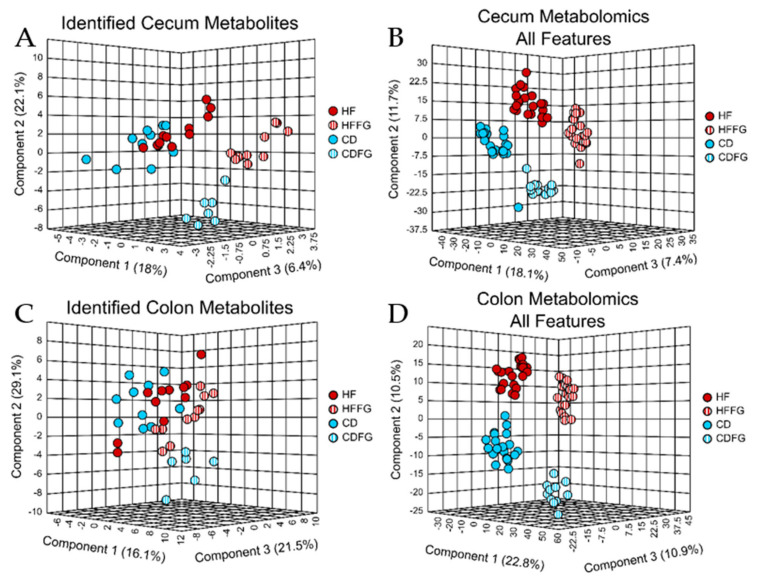
Figure 3.
Diet and FG supplementation induce distinct differences in the large intestine metabolome as shown by PLS-DA. Untargeted metabolomics was performed on the cecum and colon contents of mice fed either HF, HFFG, CD, or CDFG diets after 14 weeks of diet exposure. PLS-DA were performed for (A) identified cecum metabolites, (B) all cecum spectral features, (C) identified colon metabolites, and (D) all colon spectral features. Cross validation values can be found in Supplementary Table S1. Experimental replicates are shown; HF samples are shown in red, HFFG samples are shown in red stripes, CD samples are shown in blue, and CDFG samples are shown in blue stripes.

