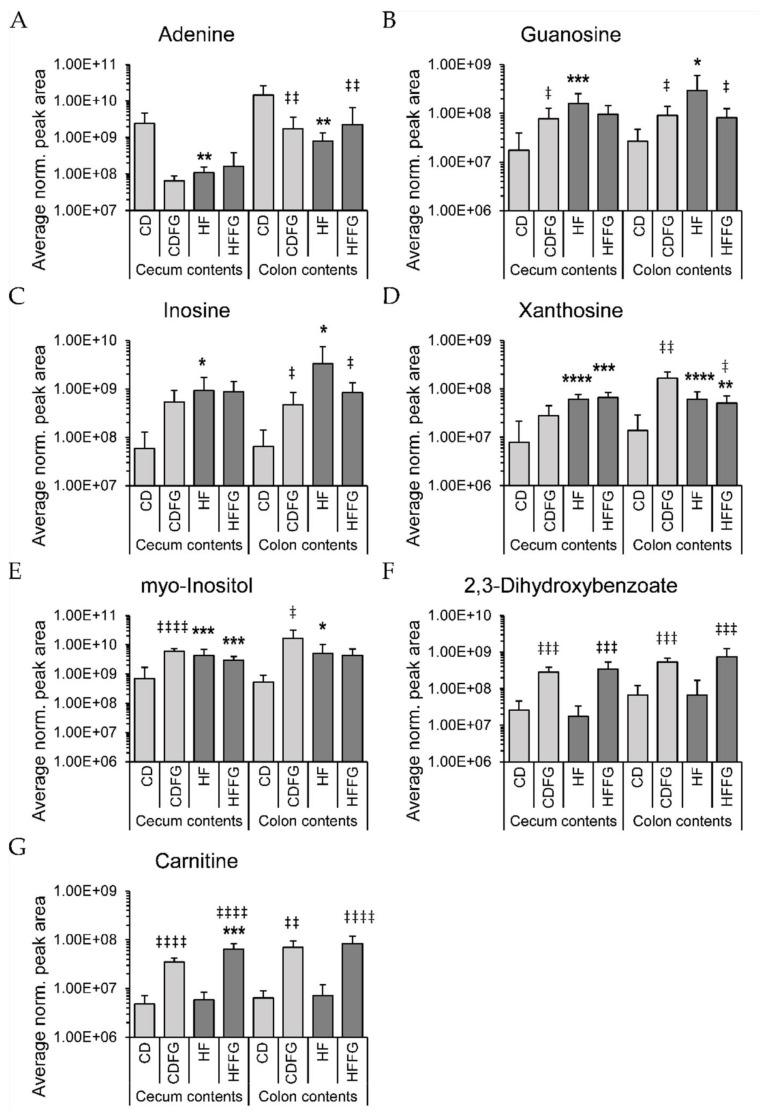
Figure 4.
Normalized intensities of (A) adenine, (B) guanosine, (C) inosine, (D) xanthosine, (E) myo-inositol, (F) 2,3-dihydroxybenzoate, and (G) carnitine from both cecum and colon data. Data were normalized according to mass and the normalized peak area is represented on a log10 scale as mean ± standard deviation. Significance was determined using a student’s t-test. Significance is represented as * p < 0.05, ** p < 0.01, *** p < 0.001, and **** p < 0.0001 for comparisons against respective CD groups or ‡ p < 0.05, ‡‡ p < 0.01, ‡‡‡ p < 0.001, and ‡‡‡‡ p < 0.0001 for comparisons against either HF or CD, respectively.

