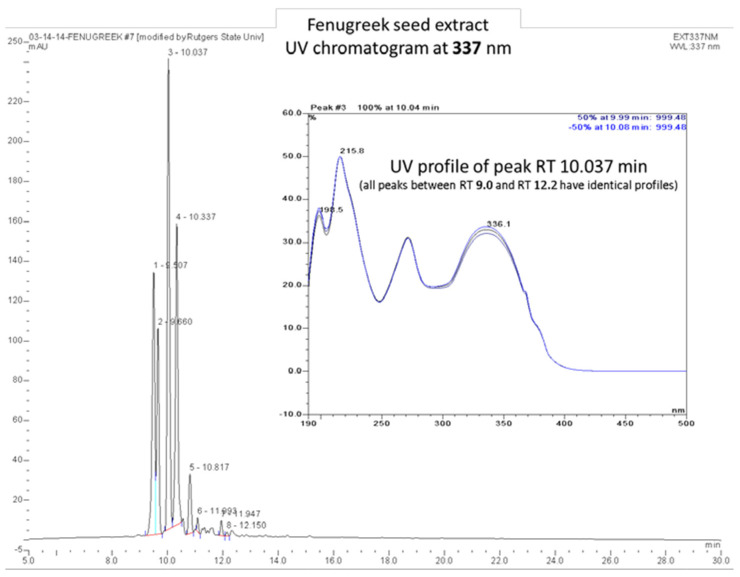
Figure A1.
UV Chromatogram fingerprint of fenugreek seed extract at 337 nm. The fingerprint shown in Figure A1 is characterized by a series of peaks between RT 8 min and RT 12.5 min which appear to be polyphenols, mainly flavonoid di- and trisaccharides, based on their corresponding masses*, MS profiles, and UV profiles. The inserted UV spectrum is identical for all peaks suggesting similar phytochemical identity.

