Figure 1.
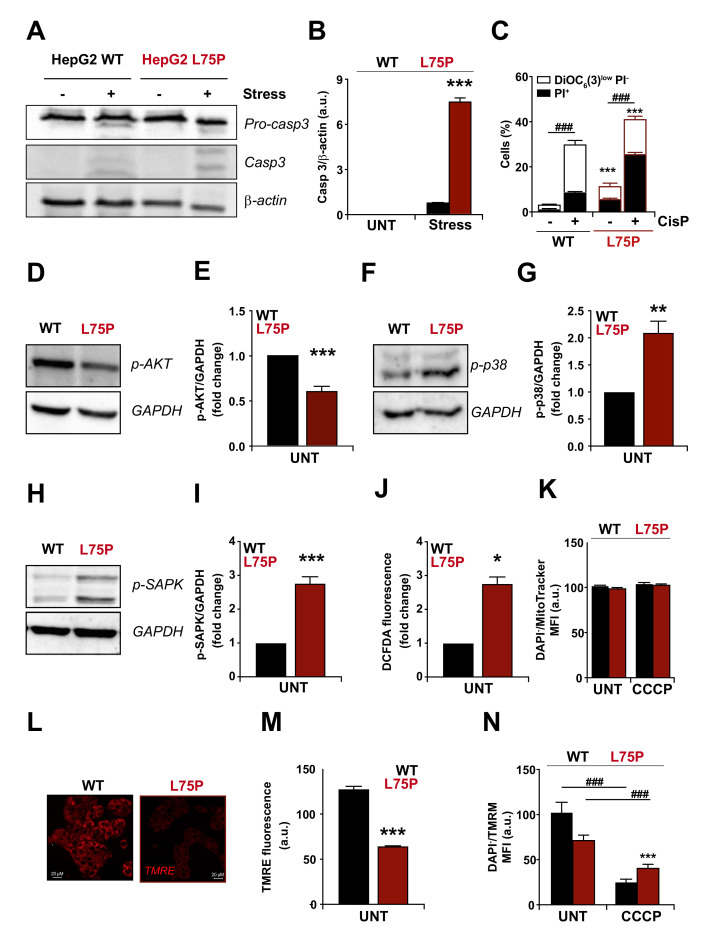
Alteration of cellular redox homeostasis in L75P-ApoA-I expressing cells. (A,B) Stress-induced apoptosis in L75P-ApoA-I expressing cells. Wild type (WT) or L75P-ApoA-I (L75P) HepG2 cells were cultured in control conditions (UNT) or maintained in FBS-free medium (stress) and analysed by immunoblotting with antibodies specific for caspase-3 (Casp3) and β-actin (loading control). Apoptosis activation coincides with a reduction in the intensity of the pro-caspase 3 band paralleled by an increase of the bands corresponding to the active fragments (the relative densitometry is shown; means ± SD of at least three independent experiments). (C) Cytometric quantification of cell death induced by cisplatin treatment (CisP). WT and L75P HepG2 cells were treated, collected, and double stained with PI and DiOC6(3) for the detection of dying (DiOC6(3)low-PI−) and dead (PI+) cells. (D–I) Mechanistic insights of L75P-ApoA-I expressing cells. WT and L75P HepG2 cells were cultured in control conditions, followed by the assessment of AKT (D,E), p38 (F,G) and SAPK/JNK (H,I) phosphorylation (the relative densitometry is shown). GAPDH levels were monitored to ensure equal loading of lanes. (J–N) Expression of L75P-ApoA-I causes significant mitochondrial dysfunction. Intracellular oxidative stress was determinate as presence of cytosolic reactive oxygen species (ROS) and assessed by dichlorodihydrofluorescein (DCFDA) fluorescence intensity in WT and L75P HepG2 cells (J). Cells were cultured for 1 h with carbonyl cyanide 3-chlorophenylhydrazone (CCCP, 10 µM) then subjected to staining with MitoTracker and 4′,6-diamidino-2-fenilindol (DAPI) (K). ROS measurements are from three independent experiments made in duplicates (means ± SEM). Changes in mitochondrial membrane potential (Δψm) were measured in wild type and L75P-ApoA-I HepG2 cells using tetramethylrhodamine ethyl ester (TMRM) TMRE probe (L,M). Since TMRE accumulates only in mitochondria with high Δψm, the change in TMRE fluorescence intensity indicates a fall in Δψm as a result of ApoA-I expression. Images are from one experiment and representative of three independent experiments made in triplicates. Cells were cultured for 1 h CCCP (10 µM) then subjected to staining with TMRM and DAPI (N). If not specified, the panels in this figure are shown as means ± SD of at least three independent experiments. Asterisks symbols indicate significant changes with respect to WT cells (* p < 0.05, ** p < 0.01, *** p < 0.001). Hash symbols indicate significant changes respect UNT condition (### p < 0.001). a.u. arbitrary units; MFI: Mean Fluorescence Intensity.

