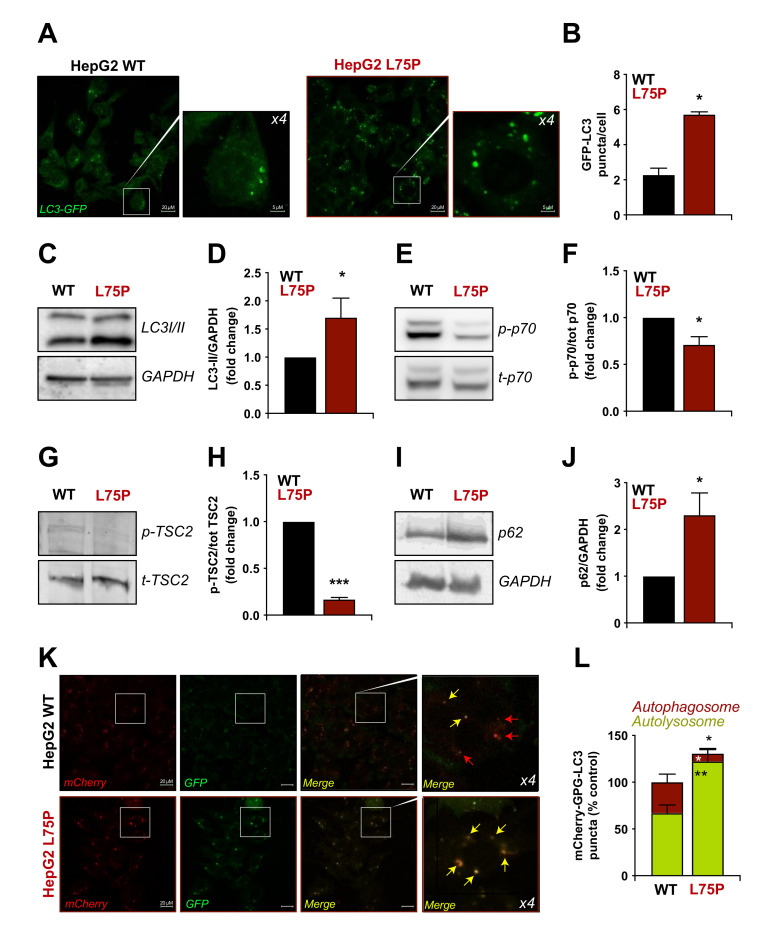
Figure 2.
Measurement of autophagy in L75P-ApoA-I expressing cells. (A,B). Wild type (WT) and L75P-ApoA-I (L75P) HepG2 cells were transiently transfected with GFP-LC3, maintained in control conditions and the number of cytoplasmic GFP-LC3 dots per cell was quantified. (C–J). WT and L75P HepG2 cells were maintained in control conditions. Thereafter, LC3 lipidation (C), p70 (E) and TSC2 (G) phosphorylation as well as p62 levels (I,J) were quantified by immunoblot. GAPDH levels (D–I), total p70 (t-p70) (E) or total TSC2 (t-TSC2) (G) levels were monitored to ensure equal loading of lanes, and densitometry was employed to quantify the abundance of lipidated LC3 (LC3-II) (D), p70 (F) and TSC2 (H) phosphorylation and p62 (J). (K,L). WT and L75P HepG2 cells were transfected with the empty vector or pDest-mCherry-GFP-LC3B plasmid. After 24 h, the number of yellow vesicles (autophagosomes) and red vesicles (autolysosomes) was quantified. Images are from one experiment and representative of three independent experiments made in triplicates. If not previously specified, the panels in this figure are shown as means ± SD of at least three independent experiments. Asterisks symbols indicate significant changes with respect to WT cells (* p < 0.05, ** p < 0.01, *** p < 0.001).

