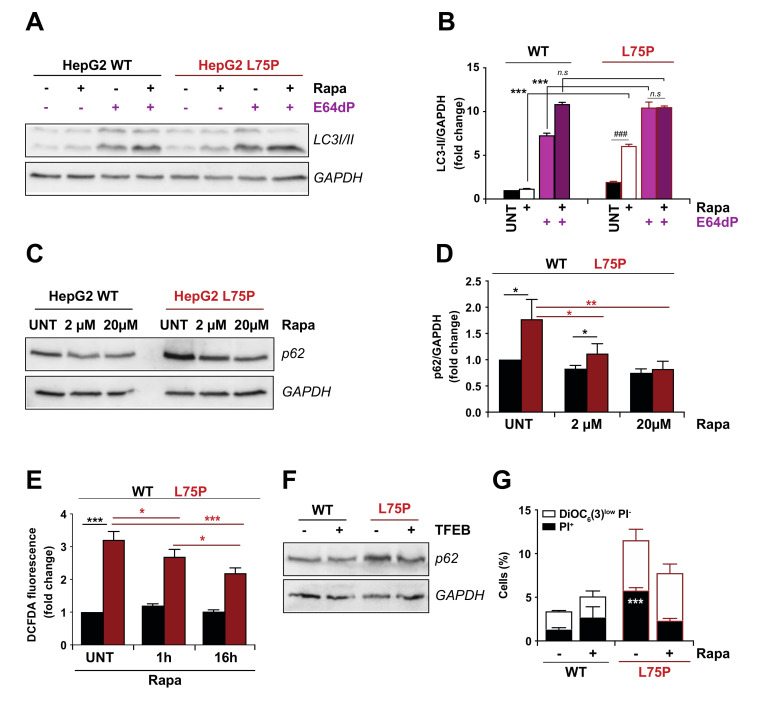
Figure 3.
Effect of pharmacological induction of autophagy in L75P-ApoA-I expressing cells. (A–D). Autophagic flux evaluation. Wild type (WT) and L75P-ApoA-I (L75P) HepG2 cells were maintained in control conditions (UNT), treated with rapamycin (Rapa, 20 μM), alone or in combination with E-64d and pepstatin-A (E64dP) (5 μg/mL each) (A). Thereafter 24 h, LC3 lipidation was assessed (B). In other experiments, the cells were treated with increasing Rapa concentrations (2 or 20 μM) for 6 h and p62 levels were quantified (C). Densitometry in was employed to quantify the abundance of p62 (normalized to GAPDH levels) (D). (E) Intracellular oxidative stress was determinate as presence of cytosolic reactive oxygen species (ROS) and assessed by dichlorodihydrofluorescein (DCFDA) fluorescence intensity in WT and L75P HepG2 cells treated with Rapamycin (Rapa; 20 μM) for 1 or 16 h. (F) WT and L75P HepG2 cells were transfected with the empty vector or GFP-TFEB plasmid. 24 h after, the p62 levels were quantified. GAPDH levels were monitored to ensure equal loading of lanes. (G) Cytometric quantification of cell death after rapamycin treatment. WT and L75P HepG2 cells were treated, collected, and double stained with PI and DiOC6(3) for the detection of dying (DiOC6(3)low-PI−) and dead (PI+) cells. The immunoblot bands are from one experiment representative of three independent experiments. If not previously specified, the panels in this figure are shown as means ± SD of at least three independent experiments. Asterisks symbols indicate significant changes with respect to WT cells (* p < 0.05, ** p < 0.01, *** p < 0.001). Hash symbols indicate significant changes respect UNT condition (### p < 0.001).

