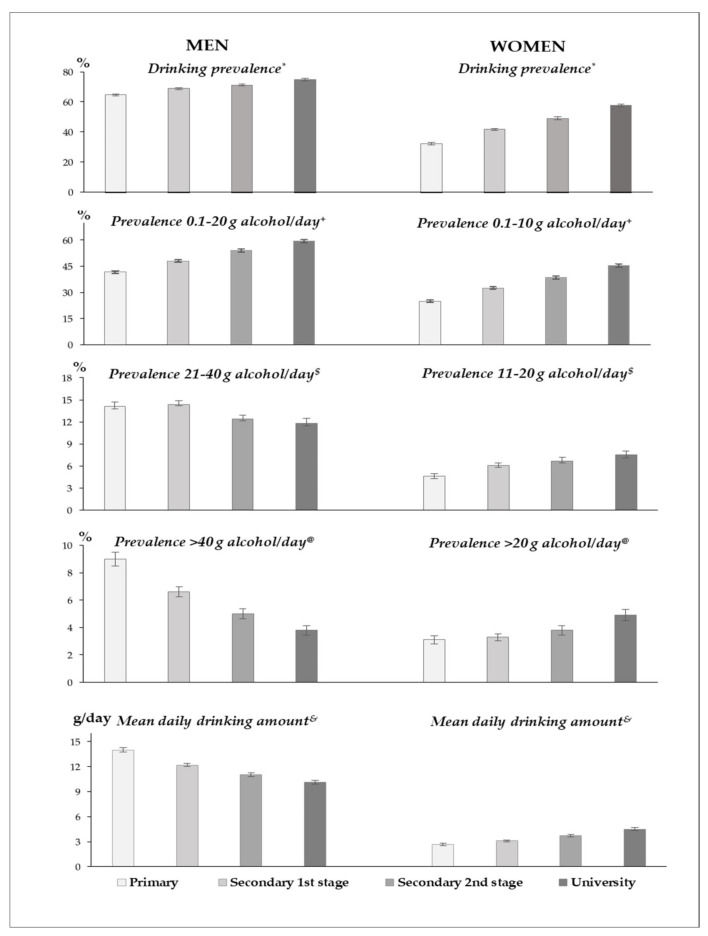
Figure 1.
Age-standardized measures of amount of alcohol intake among population aged 25–64 by sex and education level, Spain 1997–2017. Legend: Values were directly standardized using the 2013 European Standard Population weights. * Linear trends across education levels were significant both among men (β = 0.05, p < 0.001) and women (β = 0.18, p < 0.001). + Linear trends across education levels were significant both among men (β = 0.12, p < 0.001) and women (β = 0.19, p < 0.001). $ Linear trends across education levels were significant both among men (β = −0.08, p < 0.001) and women (β = 0.14, p < 0.001). @ Linear trends across education levels were significant both among men (β = −0.31, p < 0.001) and women (β = 0.16, p < 0.001). & Linear trends across education levels were significant both among men (β = −0.11, p < 0.001) and women (β = 0.17, p < 0.001).

