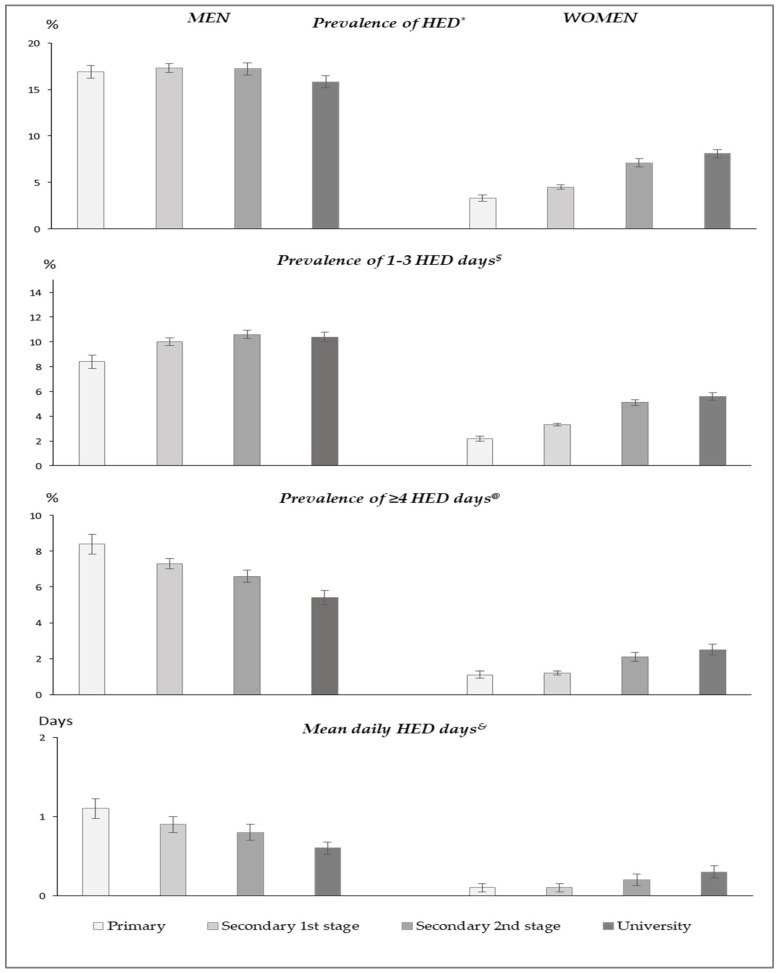
Figure 2.
Age-standardized measures of frequency of heavy average drinking among population aged 25–64 by sex and education level, Spain 1997–2017. Legend: Values were directly standardized using the 2013 European Standard Population weights. * Linear trends across education levels were significant both among men (β = −0.02, p = 0.021) and women (β = 0.32, p < 0.001). $ Linear trends across education levels were significant both among men (β = 0.06, p < 0.001) and women (β = 0.32, p < 0.001). @ Linear trends across education levels were significant both among men (β = −0.14, p < 0.001) and women (β = 0.30, p < 0.001). & Linear trends across education levels were significant both among men (β = −0.19, p < 0.001) and women (β = 0.29, p < 0.001).

