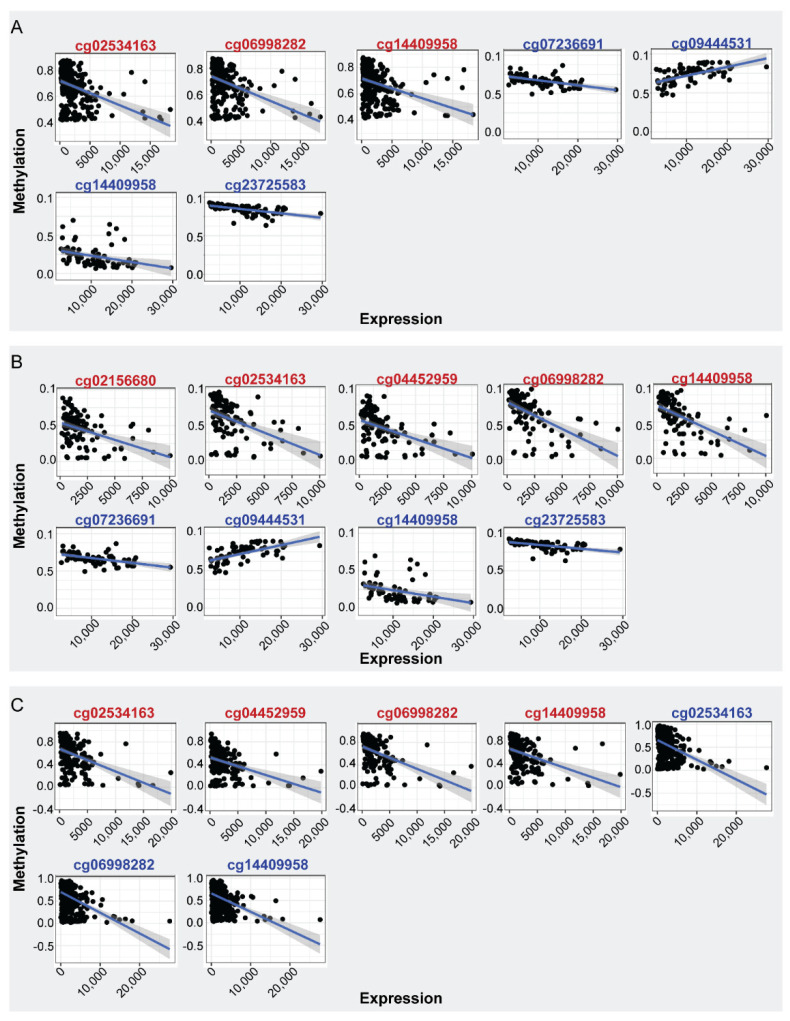
Figure 2.
Spearman correlation of ENPP2 CGs methylation and mRNA expression. CGs showing significant correlations are depicted (|rho| >= 0.40, FDR < 5 × 10⁻²). (A) Expression-methylation scatter plots of CG sites of BrCa (red) and normal (blue) samples, (B) expression-methylation scatter plots of CG sites of BrCa stage I (red) and normal (blue) samples, (C) expression-methylation scatter plots of CG sites of advanced (red) and early (blue) BrCa samples.

