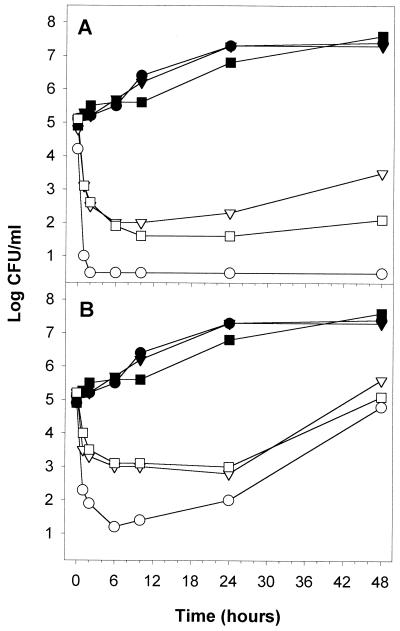
FIG. 10.
Time-kill curves of polygodial comparing S. cerevisiae W303-1a to petite mutants, which are respiration deficient, in RPMI 1640 with MOPS (pH 7) plus 2% glucose. Results for controls are represented with filled symbols, and those for polygodial-treated cells are represented with open symbols as follows: ● and ○, W303-1a; ▾ and ▿, [rho−] strain; and ■ and □, [rho0] strain. Concentrations of polygodial were 6.25 μg/ml (A) and 3.13 μg/ml (B).

