Figure 1.
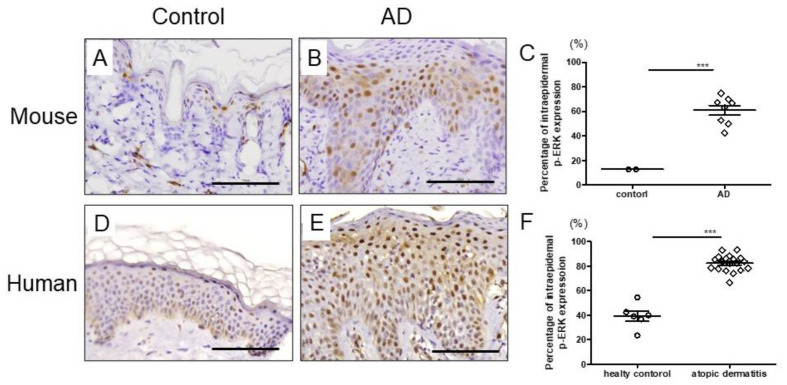
The expression of p-ERK in mouse and human skin. Immunohistochemical staining for p-ERK in normal (A,D) and AD (B,E) skin. Scale bar: 100 μm (C) Percentage of intraepidermal p-ERK expression of control (n = 2) and AD (n = 8) in mice. (F) Percentage of intraepidermal p-ERK expression of control (n = 6) and AD (n = 17) in human. All data are presented as mean ± standard error of the mean (S.E.M.). *** p < 0.001 Student’s unpaired two-tailed t-test.

