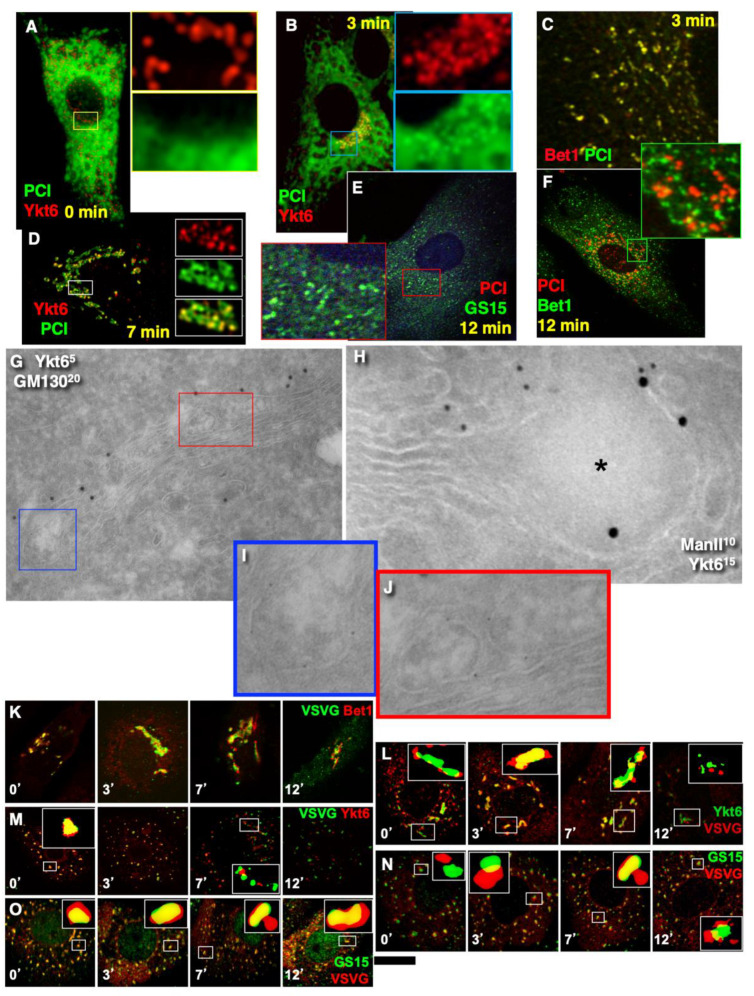
Figure 10.
Enrichment of SNAREs in membranes surrounding the cargo domains. (A–J) Human fibroblasts. (K–O) HeLa cells. (A–F,K–O) Fluorescence microscopy. (G–J) Tokuyasu cryo-sections. (A–O) Mini-wave. (A) Before the release of the transport block, Ykt6 was a little enriched at ER exit sites. (B) At 3 min after the release of the transport block, PCI formed dots where Yklt6 became enriched. (C) PCI dots co-localised with Bet1. (D) At 7 min after re-initiation of intra-Golgi transport, PCI and Ykt6 dots were co-localised. (E,F) At 12 min after re-initiation of intra-Golgi transport, PCI dots lost their co-localisation with Ykt6 and Bet1 but acquired co-localisation with GS15. (G–J) Enrichment of Ykt6 in membranes surrounding PCI distensions (blue, red boxes). (I,J) Enlargement of areas inside the blue and red boxes in (G). (K,L) VSVG-containing dots acquired Bet1, then Ykt6, and finally GS15, whereas Bet1 disappeared in these dots. (M–P) Fluorescence microscopy. Ministacks (pre-treatment of cells with 33 µM nocodazole for 3 h). Times of IGT are indicated on images ((K–O); quantified in Figure 2N,O). Scale bars: 4 µm (A–F,K–P); 130 nm (G); 90 nm (H).

