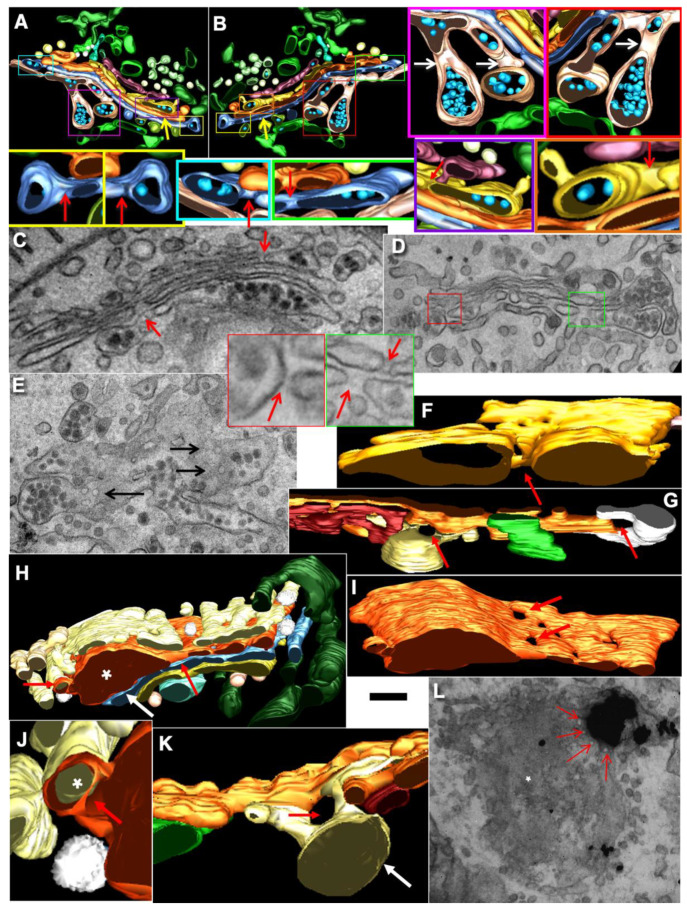
Figure 11.
At steady-state (A–E) and during the mini-wave protocol (F–L), cisternal distensions filled with VLDLs (A–E) or procollagen-I (F–L) were separated from the rest of the Golgi cisternae by rows of pores. (A–B,F–K) EM tomography. (C–E,L) Representative transmission EM images. (A,B) Three-dimensional models of the Golgi complex of hepatocytes shown from opposite views (shown in Figure 3D). Green, ER. Several boxes with different colours of their borders were enlarged and demonstrated pores separating distensions filled with VLDLs. Red arrows, pores; yellow arrows, medial cisternae; blue spheres, VLDLs. (C,D) Pores (red arrows) between VLDL distensions and the rest of Golgi cisternae. Below: Enlargements of the areas inside the red and green-bordered boxes in (D). (E) Tangential section of Golgi cisternae with pores (black arrows). (F–K) Three-dimensional models that show pores (red arrows) between cisternae and PCI distensions. White asterisks in (H) and (J) indicate the lumen of cisternal distensions. (J) Red arrow, continuity between PC distension and another cisterna. (L) Tangential section of the Golgi stack. White asterisk indicates Gollgi cisterna. Scale bars: 210 nm (A,B); 120 (C,F–I,K); 170 nm (D,E); 240 nm (L).

