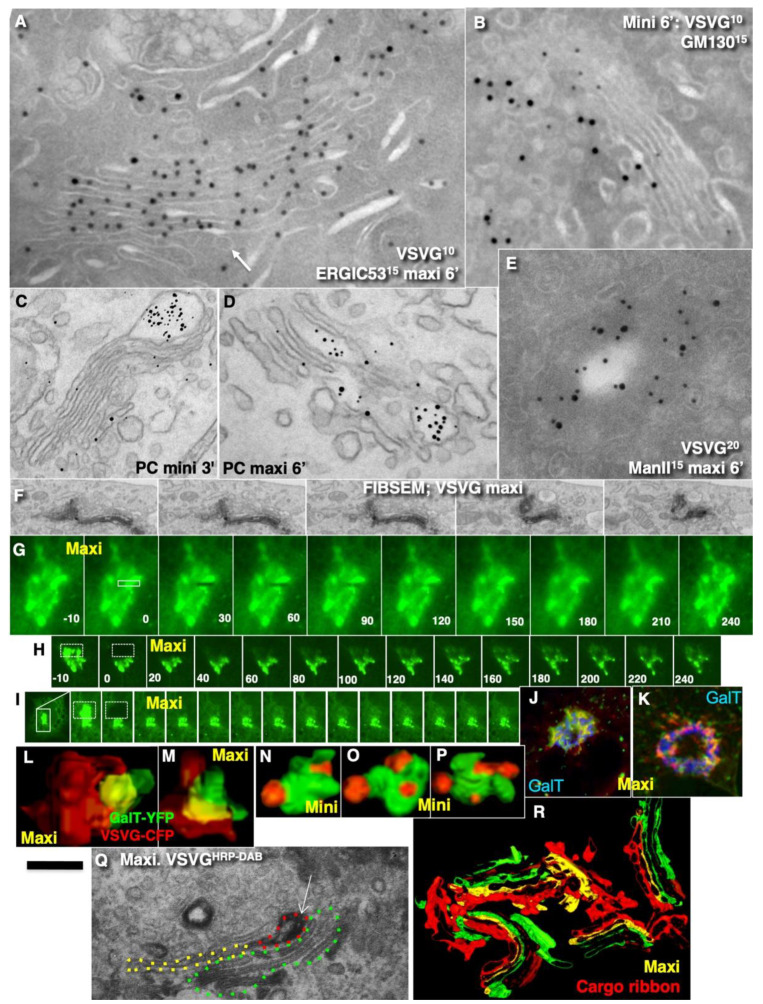
Figure 13.
The pattern of intra-Golgi transport depends on the amount of cargo transported. (A,B,E–R) Hela cells. (C,D) Human fibroblasts. Protocols of cargo synchronisation are shown in images, as the mini-wave (B,C,N–P) and the maxi-wave (A,D–M,Q,R). (A,B,E) Tokuyasu cryo-sections. HeLa cells were transfected with VSVG-GFP (10-nm gold immunolabelling) and subjected to the maxi-wave and mini-wave protocols of cargo synchronisation. When a large amount of VSVG-GFP was transported (A), this cargo penetrated up to the trans-most cisterna (white arrow). Intermixing of VSVG-GFP and ManII was higher than after the mini-wave ((E); compare with Figure 6C). During the mini-wave (B), the penetration of VSVG was lower (quantified in Figure 7G–H). (C,D) Enhanced nanogold. Human fibroblasts were stimulated to synthesise PCI and then subjected to the mini-wave (C) and maxi-wave (D) protocols of PCI synchronisation. During the maxi-wave, the penetration of PCI was deeper (quantified in Figure 7E,F). (F) Focused ion beam scanning EM (FIBSEM) analysis. Serial images show that the immune–EM labelling for VSVG–GFP is not interrupted and forms a ribbon. (G–I) Fluorescence recovery after photobleaching (FRAP). HeLa cells were transfected with VSVG–GFP and then subjected to the maxi-wave protocol (see Methods). Then, the whole cell less half of its Golgi complex was bleached, and the FRAP was examined at 4 (G), 8 (H) and 12 (I) min after the initiation of intra-Golgi transport. Kymographs. Images were taken at times shown in (A,B) and every 30 s (G) or every 20 s (H,I). Fast FRAP was observed in (G,B). Lower FRAP was observed in (H). Very low FRAP was observed in (I). Data are quantified in Figure 7I. (J,K) Immunofluorescence. Overlapping of Golgi ribbon filled with VSVG-GFP before (green) and after bleaching and refilling (red). There is a high level of overlap. Significant areas of yellow colour suggest that the second portion of VSVG-GFP moved along the same structures where the first portion of VSVG-GFP was already present. The yellow zones show low co-localisation with GalT (blue). (L–P) Immunofluorescence. Three-dimensional reconstruction of Golgi fragments visible at the immunofluorescence level after synchronisation of VSVG according to the maxi-wave (L,M) and mini-wave (N–P) protocols. One large cargo sphere is formed in the first case, and several small spheres are formed in the second case. (Q) Immuno-EM labelling for VSVG with DAB reaction. The contour of the DAB-positive structures is traced with red dashed lines, the contours of the empty zones of the same cisternae are contoured with a yellow dashed line, and the other cisternae were contoured with green dashed lines. (R) Three-dimensional models of the Golgi cargo ribbons. Red structures form ribbons connecting different Golgi stacks. When a large amount of VSV-GFP was transported, these membranes formed a continuous ribbon. Previously we demonstrated that ManII-positive compartments of the Golgi form a ribbon [19]. Scale bars: 180 nm (A,B) 240 nm (C,D); 190 nm (E); 1.3 µm (F); 5 µm (G); 12 µm (H,I); 3 µm (J,K); 250 nm (Q); 450 (R).

