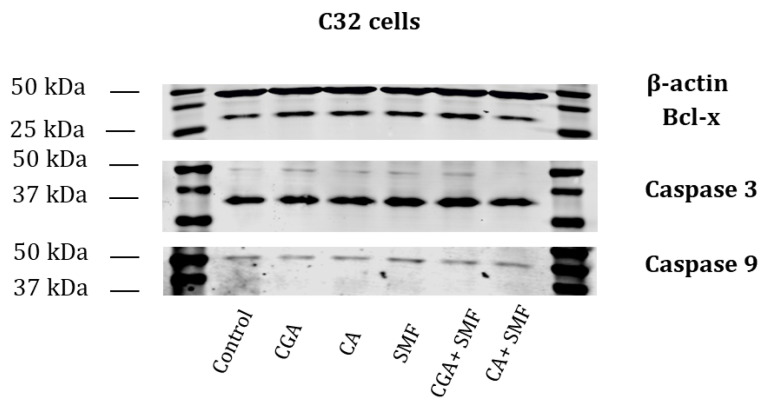
Figure 5.
Western blot. B-actin, Bcl-x, Caspase 3, Caspase 9. Representative western blot image of the protein extracts from the C32 cells. Cell lines: control cells, CGA—chlorogenic acid-treated cells, CA—caffeic acid-treated cells, SMF—cell that had been exposed to a static magnetic field, CGA + SMF—cells that had simultaneously been exposed to chlorogenic acid and a static magnetic field, CA+—cells that had simultaneously been exposed to caffeic acid and a static magnetic field.

