Figure 6.
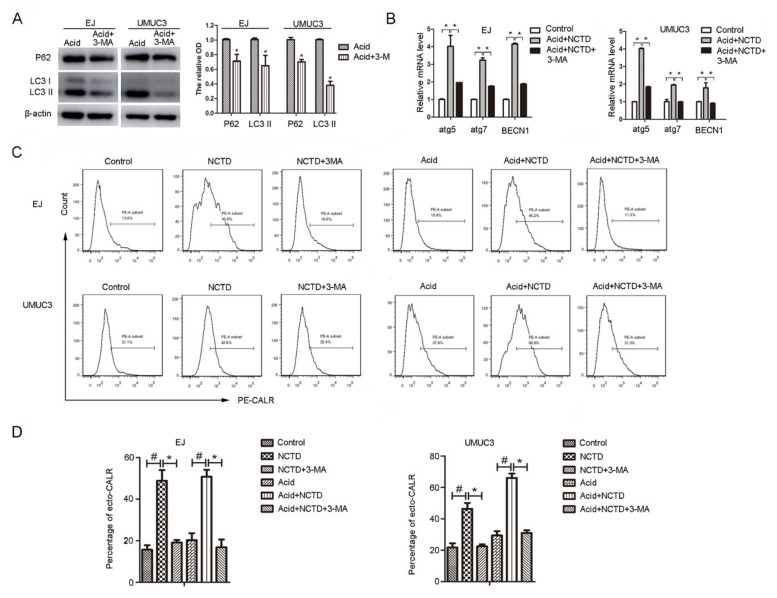
Inhibition of autophagy decreased the ecto-CALR induced by NCTD. (A) EJ and UMUC3 Cells were exposed to 3MA (5 mM) in acidic medium, P62 and LC3 protein levels were evaluated by Western blotting, β-actin was used as an internal control and relative protein levels were measured. (B) Cells were treated with NCTD (3 μM) with or without 3-MA (5 mM) in acidic medium for 24 h, mRNA levels of atg5, atg7, and BECN1 were detected by Real-time PCR. Data are presented as the mean ± SD (n = 3), * p < 0.05 vs. the acid group. (C) Flow cytometry analysis of ecto-CALR exposure on the cells treated with NCTD with or without 3-MA (5 mM) in physiological and acidic culture. (D) Quantification of the percentage of ecto-CALR. Data are presented as the mean ± SD (n = 3), * p < 0.05 vs. the NCTD group, # p < 0.05 vs. the control group.

