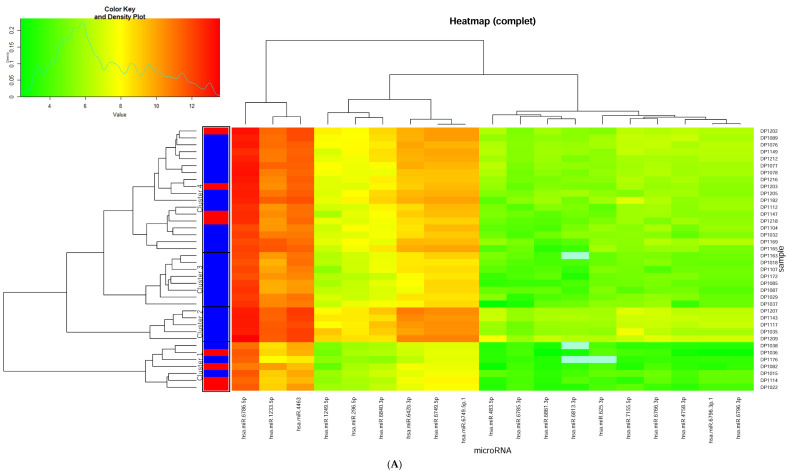
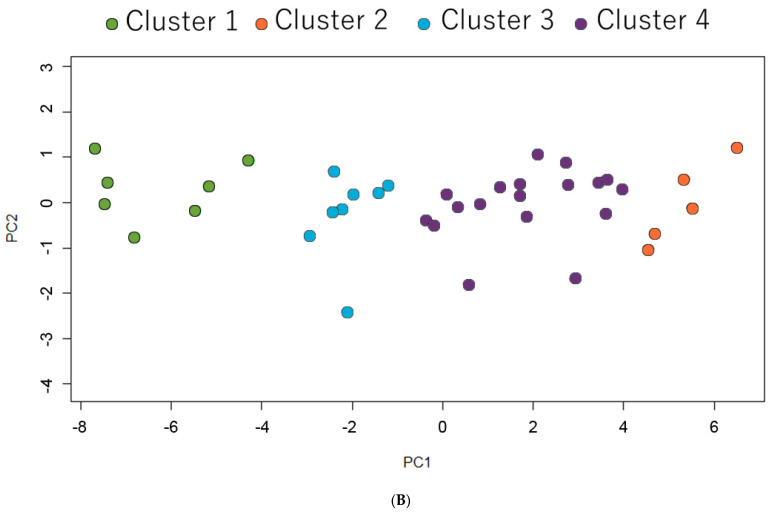
Figure 3.
(A) Hierarchical clustering of subjects treated with selective serotonin reuptake inhibitors based on pre-treatment miRNA levels. Caption: The heat map was generated using 17 miRNAs that were significantly associated with a Hamilton Rating Scale for Depression score change at week 2 (adjusted p < 0.05) and also correlated with week 2 response with an unadjusted p-value < 0.01. (B) Principal component analysis of subjects classified into four categories based on partitional clustering analysis. Caption: Cluster plot points according to the first two principal components (PC1 and PC2) that explain 91.4% of the total variance.


