Figure 7.
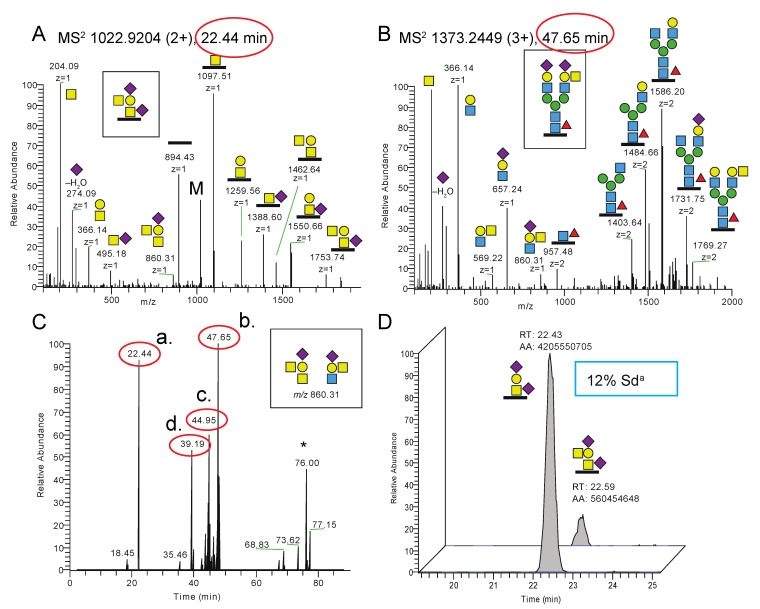
Glycoproteomic analysis of erythrocyte glycoproteins of a Cad sample. (A) MS2 spectrum of a glycopeptide DTYAATPR (residues 51–58) of GLPA carrying an O-glycan Sda epitope from the Cad-a sample. M denotes remaining precursor ions at m/z 1022.92. The MS2 spectrum of the corresponding non-Sda O-glycopeptide is shown in Supplementary Figure S2A. (B) MS2 spectrum of a glycopeptide LSVPDGFKVSNSSAR.G (residues 632–645) of B3AT with an N-glycan with the Sda epitope on one of the antennae obtained from the Cad-a individual. (C) Extracted MS2 ion chromatogram of the diagnostic ion at m/z 860.31 (occasionally measured as m/z 860.32, the exact mass is 860.3143 u). The major peaks (red encircled a.–d.) are indicated and identified in panels A and B and in the Supplementary Figure S1C–E. (D) Extracted MS1 ions of the GLPA glycopeptide (residues 51–58) demonstrated a relative peak intensity of 12% of the Sda epitope for the Cad-a sample. * Not glycopeptide related.

