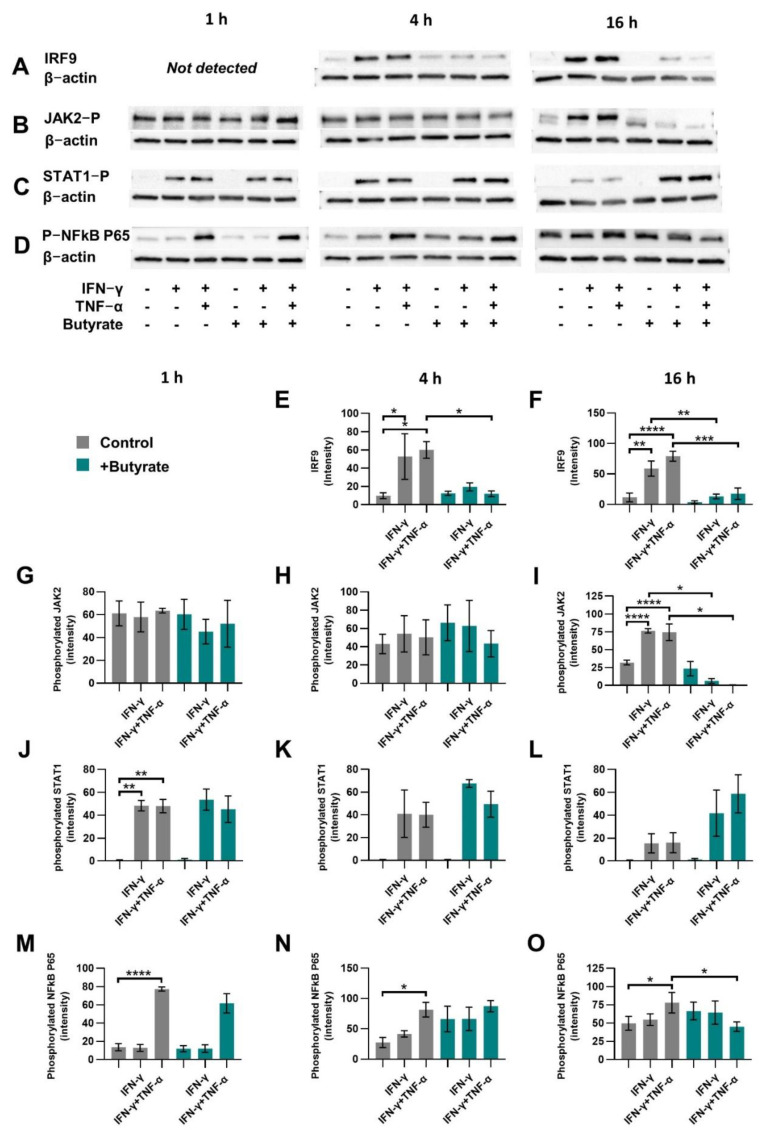
Figure 3.
Canonical or non-canonical STAT1 pathway protein expression. Cells were activated with IFN-γ or IFN-γ+TNF-α and treated with 2 mM butyrate (green bars) for 1 h, 4 h or 16 h. IRF9 (A,E,F), phosphorylated JAK2 (B,G–I), phosphorylated STAT1 (C,J–L) and phosphorylated NFkB p65 (D,M–O) protein expression was determined. Representable blots of proteins of interest and β-actin control are shown in A-D. Data are represented as mean ± SEM (n = 3). Significant differences are shown as * p < 0.05, ** p < 0.01, *** p < 0.001, **** p < 0.001, medium control as compared to 2 mM butyrate control or to IFN-γ or IFN-γ+TNF-α-activated intestinal epithelial cells in absence of butyrate. Activated cells were also compared to activated cells treated with butyrate.

