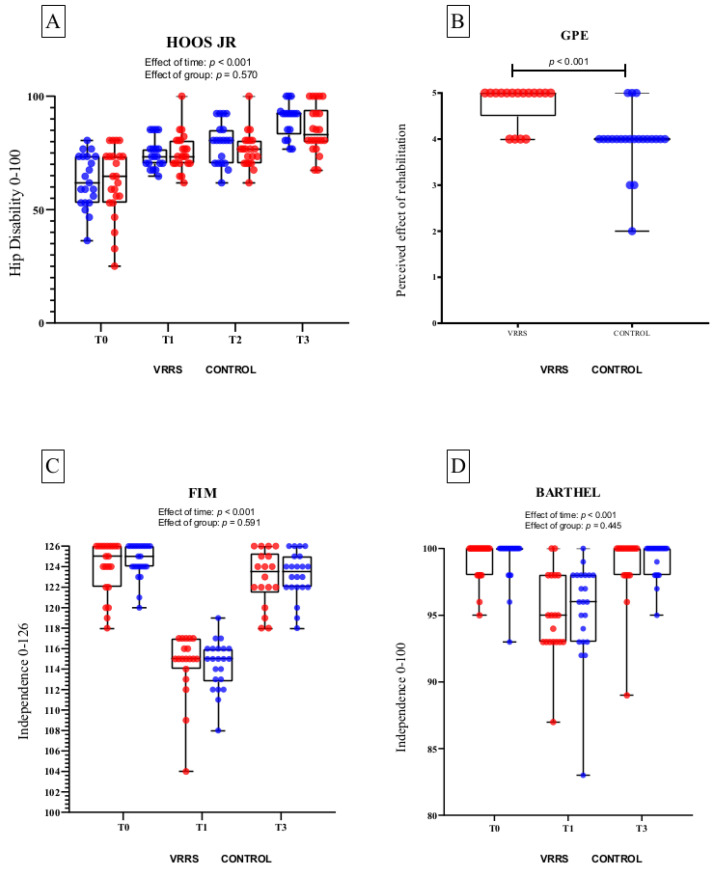
Figure 4.
Whiskers box plots and single values of HOOS JR (panel A), GPE (panel B), FIM (panel C), and Barthel (panel D) scores for VRRS group (red circles) and control group (blue circles). HOOS JR: Hip dysfunction and Osteoarthritis Outcome Score for Joint Replacement (0–100); GPE: degree of perceived effect of the rehabilitation program (0–5); FIM: Functional Independence Measure (18–126); BARTHEL: Modified Barthel Index (0–100). Details on statistical differences for the effect of time are reported in Table 3.

