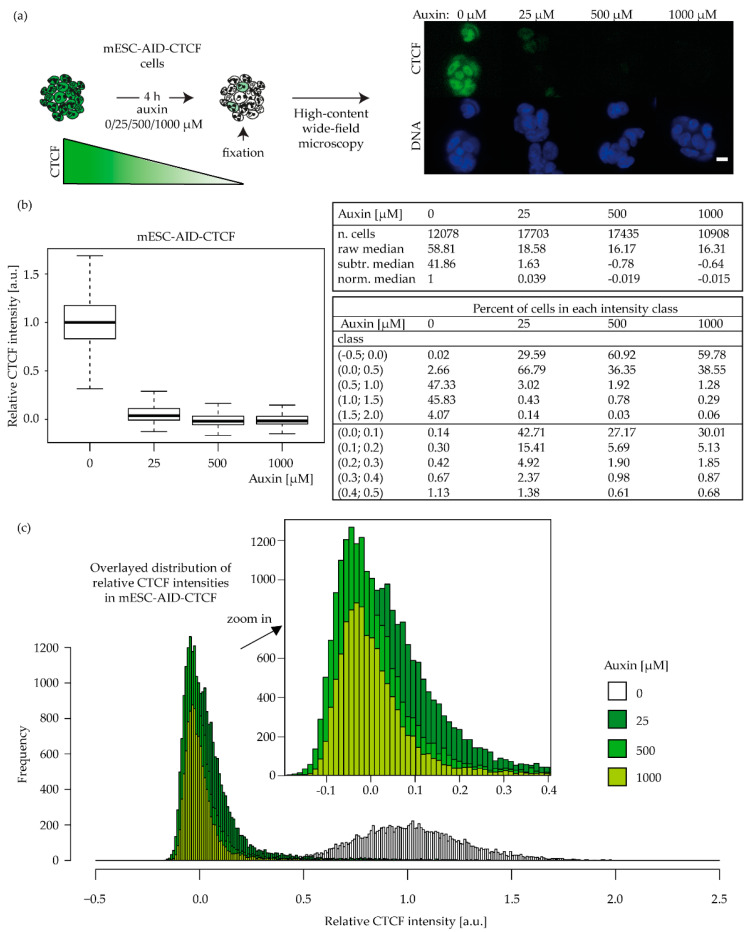
Figure 7.
Degron system validation in mESC-AID-CTCF cells. (a) Cells were subjected to different concentrations (0, 25, 500, 1000 µM) of auxin for 4 h, fixed, and imaged using a high-content wide-field microscope (scale bar 10 µm, Figure S1, Table S3); (b,c) Nuclear CTCF-GFP mean intensities were measured, the background as measured in untagged mESC was subtracted, and the resulting data were normalized to the untreated control sample (0 µM); normalized CTCF values are shown as boxplots (b) and as frequency distributions (c), together with the percent of cells lying within the different classes of CTCF intensities. The results are based on four biological replicates (Table S4). See Figure S3 for the boxplot interpretation. In Figure S6, the relative kinetics of auxin-induced CTCF depletion and recovery after auxin wash-off are further investigated in a time course experiment.

