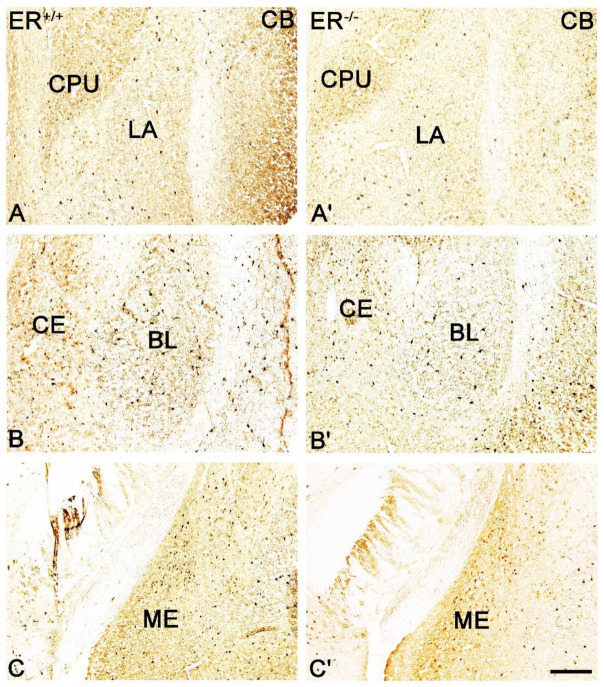
Figure 3.
Brightfield photomicrographs highlighting the immunoreactivity patterns of calbindin (CB) in the amygdala of the wild-type (ERβ+/+, (A–C)) and ERβ knock-out (ERβ−/−, (A′–C′)) mice. (A,A′): The lateral (LA) nuclei and caudate-putamen complex (CPU). (B,B′): The basolateral (BL) and central (CE) nuclei. (C,C′): The medial (ME) nucleus. Note the reduced density of CB+ neurons in the ERβ knock-out (A′–C′) subjects. Scale bar = 200 µm.

