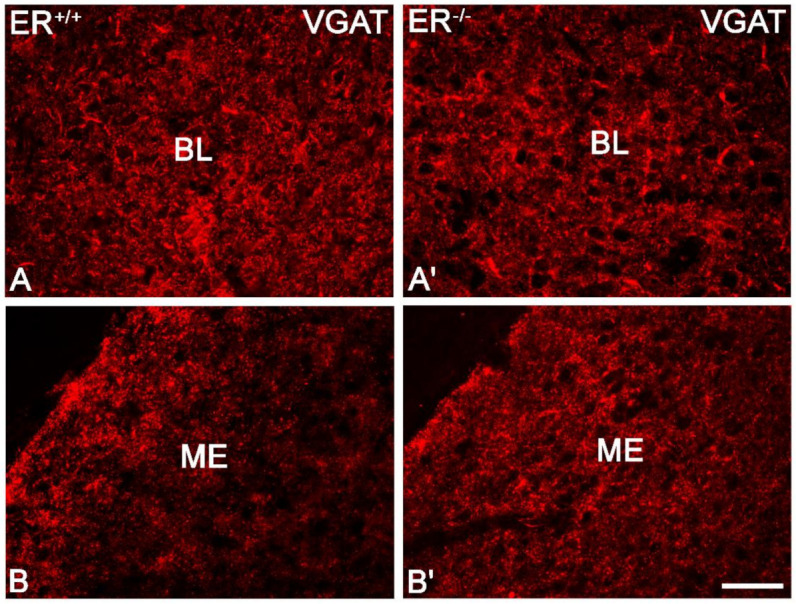
Figure 10.

Representative colour photomicrographs illustrating the staining pattern of vesicular GABA transporter (VGAT) in the amygdala of wild-type (ERβ+/+, (A,B)) and ERβ knock-out (ERβ−/−, (A′,B′)) mice. (A,A′): The basolateral (BL) nucleus. (B,B′): The medial (ME) nucleus. Note similar density (elements) and signal intensity of VGAT in the wild-type (A,B) and ERβ knock-out (A′,B′) subjects. IR elements—immunoreactive structures which include somata, fibres and puncta. Scale bar = 50 µm.
