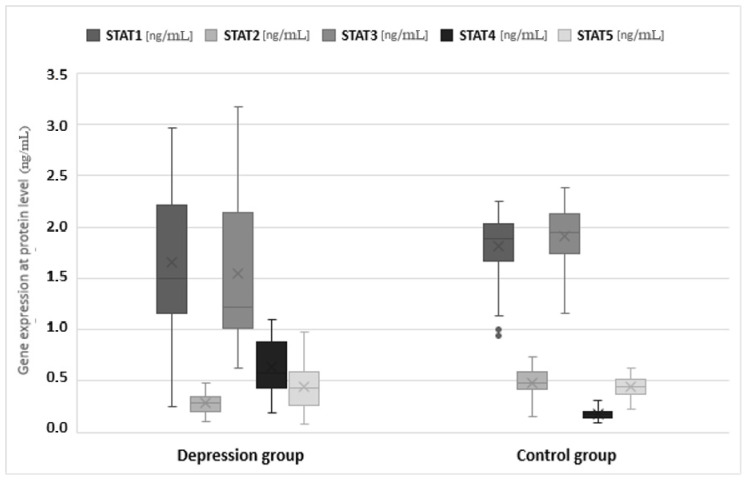
Figure 4.
Expression of signal transducer and activator of transcription (STAT) protein family genes at the mRNA level in the depression and healthy control group. Statistical significance of differences in study groups: STAT1 p = 0.0120; STAT2 p < 0.0001; STAT3 p < 0.0001; STAT4 p < 0.0001; STAT5 p = 0.6931.

