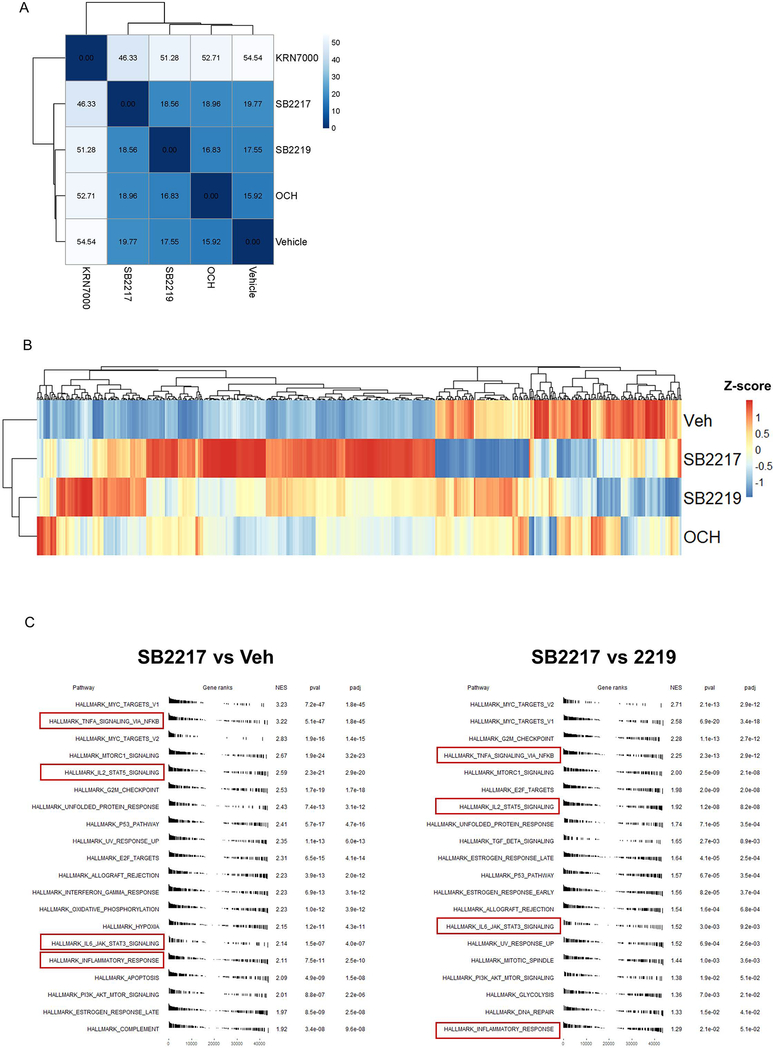
Extended Figure 8. Transcriptomic landscape of splenic NKT cells in responses to agonists.
(A) A heatmap shown with the Euclidean distances between different treatment groups. (B) Transcriptomic profile comparison of SB2217, SB2219 and OCH. (C) Pathway enrichment analysis of SB2217 reveals increased expression of immunoregulatory pathways in NKT cells when compared to vehicle or SB2219.

