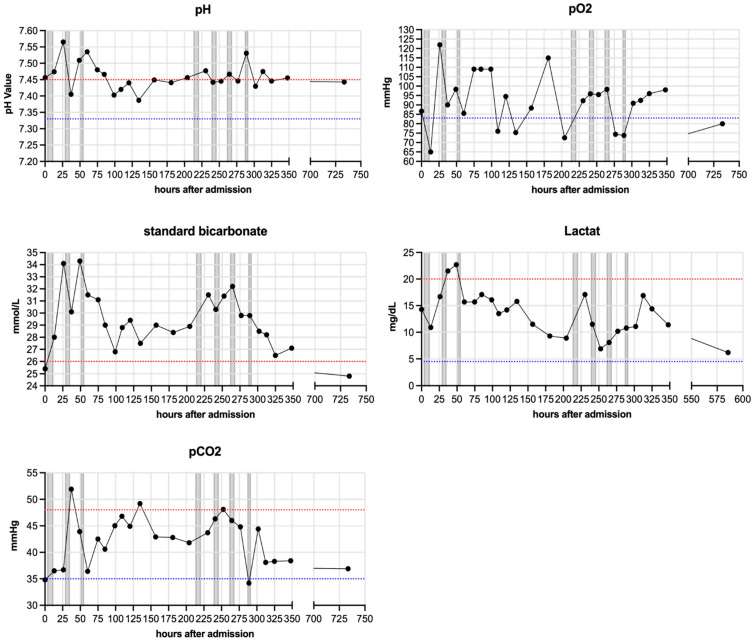
Figure 3.
Respiratory parameters of one patient (patient 4). pH, standard HCO3−, lactate, arterial pCO2 and pO2 were measured regularly for each patient and are depicted here representatively for patient 4. Blue lines indicate minimum baseline and red lines maximum baseline for each normal range. Grey bars indicate apheresis treatments.

