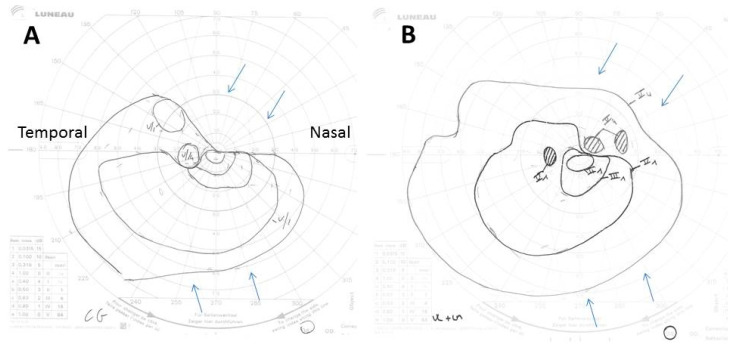
Figure 2.
(A,B) Goldman perimetry showing constriction of the superonasal left visual field (upper arrows) and to a lesser extent of its inferonasal part (lower arrows), 2 days after treatment start (A), and its improvement 10 days after its start (B). The Roman and Arabic numerals in the images correspond to an increase in size, from 0 to V, and a decrease in intensity, from 4 to 1, of the light signal sent to the patient during the examination to determine the limits of his visual field. Thus, V4 corresponds to the largest and most intense light spot possible.

