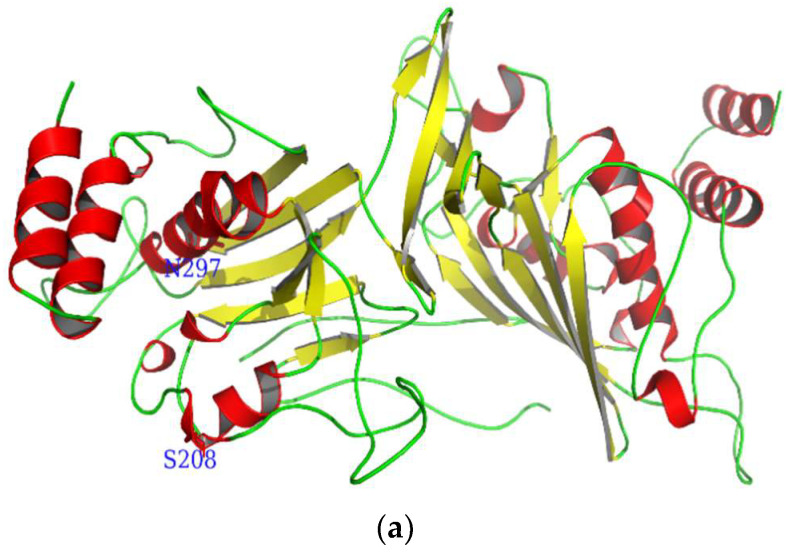
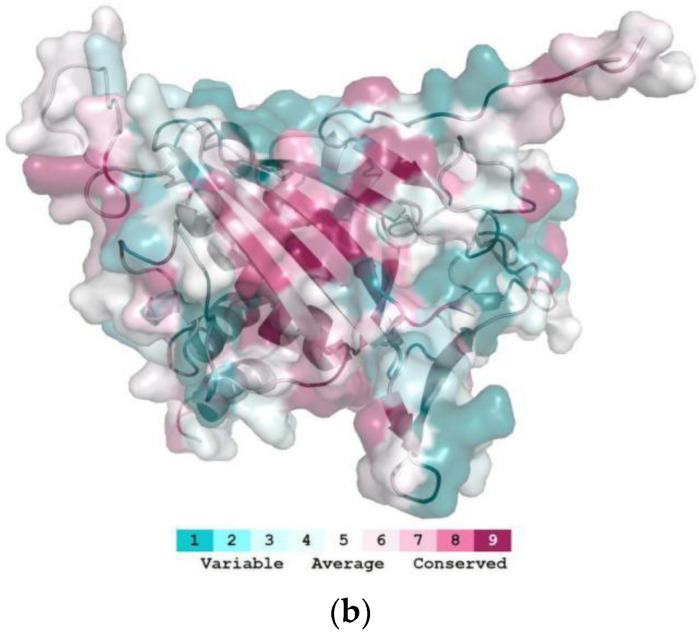
Figure 3.
Three-dimensional molecular structure of CmdsRNase. (a) This graphic was drawn using PyMOL 2.5 based on the CmdsRNase.pdb data. Red represents α-helices, yellow indicates β-pleated sheets, and green denotes random coils. S208 and N297 indicate O- and N-glycosylation, respectively. (b) The highly conserved region (in deep red) is displayed in the structure. The homology model was performed by the ConSurf software (https://consurf.tau.ac.il) (accessed on 20 December 2021) and optimized using PyMOL 2.5.


