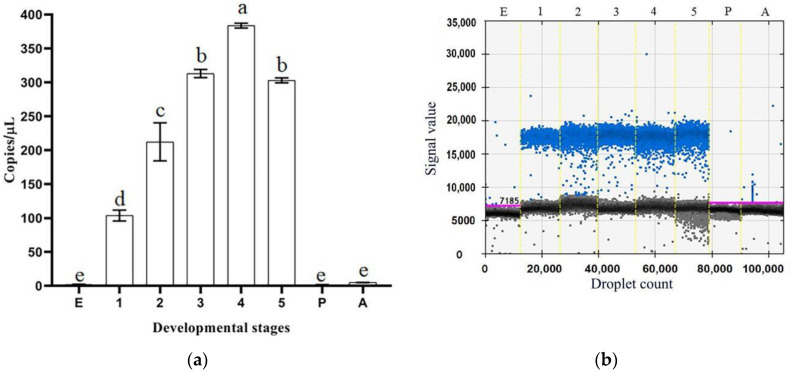
Figure 5.
Expression levels of CmdsRNase at different developmental stages of C. medinalis. (a) Histogram. (b) Droplet generation diagram. Blue and black dots indicate positive and negative, respectively. E, Egg; 1–5, first–fifth-instar larvae; P, Pupa; A, Adult. Each bar represents the mean ± SD. Different letters above the bars indicate significant differences at p < 0.05 based on Duncan’s test.

