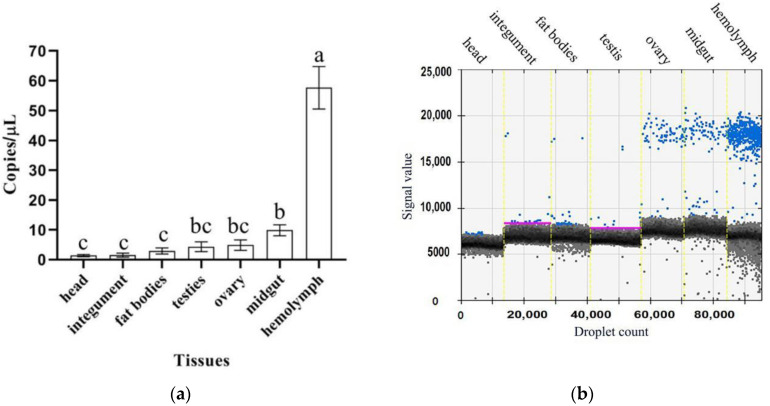
Figure 6.
Expression levels of CmdsRNase in various tissues of C. medinalis adults. (a) Histogram. (b) Droplet generation diagram. Blue and black dots indicate positive and negative, respectively. Each bar represents the mean ± SD. Different letters above the bars indicate significant differences at p < 0.05 based on Duncan’s test.

